The purpose of this study is to give some basic information about the demography of a French department (Ille-et-Vilaine - 35). The data are coming from the following French Government API (link). The data used were up-to-date as of December 2018. The data have been queried for all the department and then saved as NoSQL database locally. Thus, there is no need anymore to query from the API (except to update with latest API data) and the analysis can be done offline.
| Population | Area [km2] | Density [pop/km2] | |
|---|---|---|---|
| Minimum | 107 | 0.56 | 15 |
| Median | 1,314 | 15.81 | 74 |
| Average | 2,956 | 19.82 | 155 |
| Maximum | 211,373 | 110.66 | 4,196 |
| Total | 1,019,923 | 6,840.54 | 149 |
| Population | Area [km2] | Density [pop/km2] | |
|---|---|---|---|
| Top 3 | Rennes - 211,373 Saint-Malo - 44,919 Fougères - 20,170 |
Paimpont - 110.66 Guipry-Messac - 92.3 Val d'Anast - 76.68 |
Rennes - 4,196 Fougères - 1,934 Bécherel - 1,289 |
| Bottom 3 | La Selle-Guerchaise - 154 Lanrigan - 149 Bléruais - 107 |
La Selle-Guerchaise - 2.17 Châteauneuf-d'Ille-et-Vilaine - 1.39 Bécherel - 0.56 |
Eancé - 24 Rannée - 21 Paimpont - 15 |
Almost 21% of the department population lives in the biggest and most densely populated city, Rennes. The cities with the highest population have some of the highest density population (i.e. Rennes, Saint-Malo (5th highest density), Fougères). However, the third highest densely populated city (Bécherel) has only 722 inhabitants. This high density rate is due the size of its teritory, the smallest in the departement. The opposite phenomenon is happening for Paimpont, which has the lowest densely populated city due to the very large size of its territory, the biggest in the department.

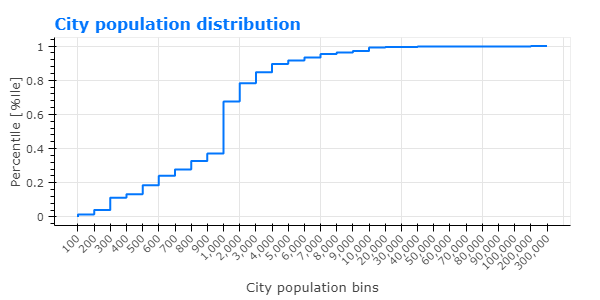
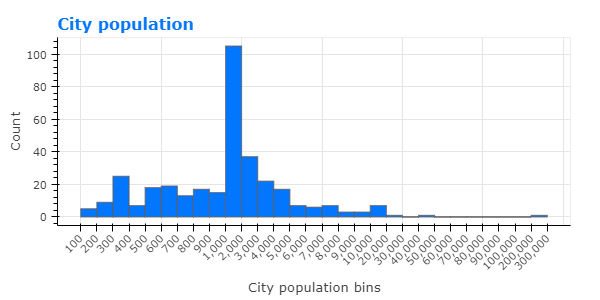
Mind the x-axis unit, logarithmic unit is used here to make the figure more readible. The most representated city population bin is between 1,000 to 2,000 inhabitants, it accounts for 30% of all the department cities. The second most represented population bin is the one ranging from 2,000 to 3,000 inhabitants (11%). Cities from 1,000 to 3,000 inhabitants represent about 41% of the department cities. 37% of the cities have up to 1,000 inhabitants. 68% of the cities have 2,000 inhabitants or less. Less than 10% of the cities have at least 5,000 inhabitants. Finally, cities accommodating more than 10,000 inhabitants account for only 1% of the department cities.
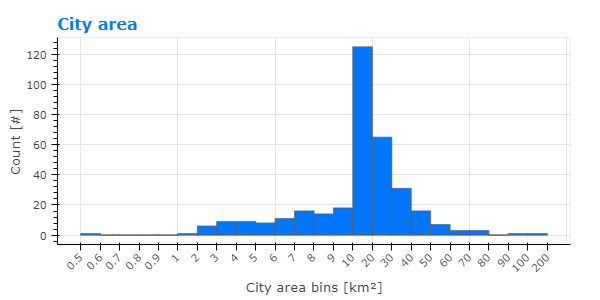
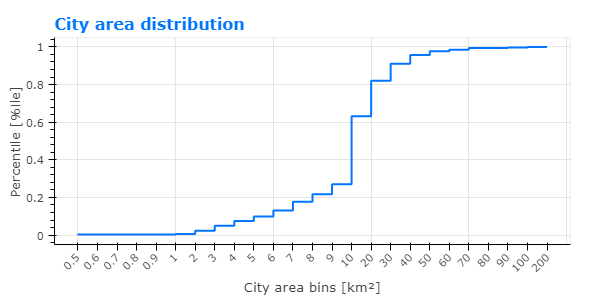
Mind the x-axis unit, logarithmic unit is used here to make the figure more readible. The majority of the cities (36%) has a territory ranging from 10 km2 to 20 km2 and 19% of the cities have an area between 20 km2 and 30 km2. Only one city has a territory lower than 1 km2. 27% of the cities have an area below or equal to 10 km2. 63% of the cities area go up to 20 km2. The cities with a territory higher than 30 km2 account for a bit less than 10% of the cities. Finally, about 2% of the cities have an area lower than 1 km2 or higher than 70 km2.
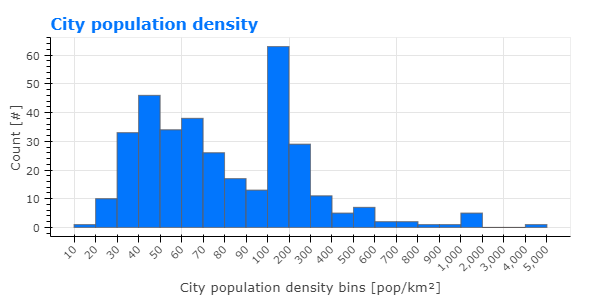
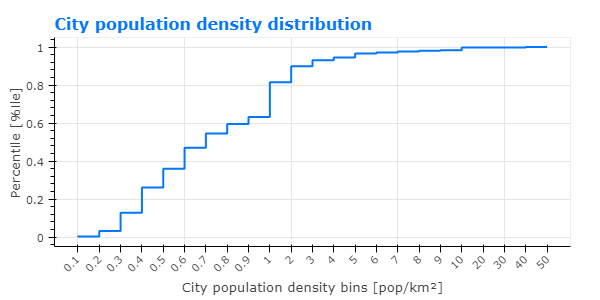
Mind the x-axis unit, logarithmic unit is used here to make the figure more readible. The most common density range is between 100 pop/km2 to 200 pop/km2. More than 50% of the cities have a density of at least 70 pop/km2. Around 20% of the cities have a density higher than 100 pop/km2.
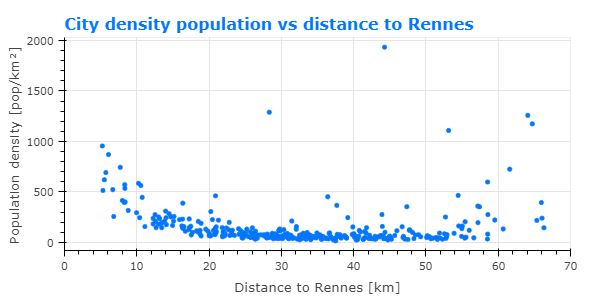
The closer, in term of distance, a city is to Rennes (most populated and densely populated city) the higher the population density is. The density decreases until around 20km from Rennes, for further distance the density is generally constant with values slightly lower than 100 pop/km2. The cities that do not follow this trend are either other major cities or cities similar as Bécherel which has a tiny territory.
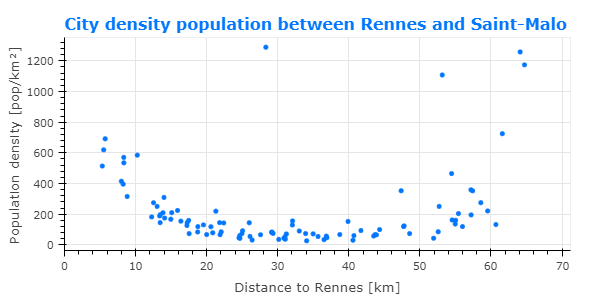
The phenomenon as on the previous figure can be seen here, the closer a city is to a major city, the higher the density is. The bigger the city is the clearer this phenomenon is. Around Rennes, this characteristics is observable up to 20km while for Saint-Malo it is visible up to about 5-10km.