The purpose of this study is to give some basic information about the underground in Rennes. The data are coming from the data platform of Rennes Métropole (link to data) queried in May 2019. The visualisation is done with the python library "bokeh".
Rennes has one underground line (line a) since 2002. This line transports about 140,000 passangers daily. A second line (line b) is currently being built which opening is planned for 2020.
| Line a | Line b | |
|---|---|---|
| Number of stations | 15 | 15 |
| Terminal 1 | J.F. Kennedy | Saint-Jacques-Gaité |
| Terminal 2 | La Poterie | Cesson Viasilva |
| euclidean distance... | ... | ... |
| Between terminals | 6.2 km | 7.6 km |
| Average between 2 stations | 583 m | 800 m |
| Median between 2 stations | 552 m | 776 m |
| Minimum between 2 stations | 378 m Charles de Gaulle - Gares |
535 m Saint Germain - Sainte Anne |
| Maximum between 2 stations | 782 m Gares - Jacques Cartier |
1,116 m Cleunay - Mabilais |
The euclidean distance is the shortest distance between 2 points. The railway track length is at least equal to the euclidean distance. The railway path does not always follow a straight line because of various constraints.
Both underground lines have the same amount of stations (15), however the line b is longer than the line a by 1.4 km (+22.6%). The average, minimum and maximum euclidean distances between 2 stations are higher for line b compared to line a. The figure 1 highlights the wider gap between stations of the line b.
| Length | Line a | Line b | Difference (a-b) |
|---|---|---|---|
| Total | 9,696 m | 13,727 m | -4,031 m (-42%) |
| Between terminals | 8,587 m | 12,949 m | -4,362 m (-51%) |
| Tunnel | 3,680 m | 8,062 m | -4,382 m (-119%) |
| Covered trench | 3,030 m | 1,782 m | 1,248 m (+41%) |
| Viaduct | 945 m | 2,077 m | -1,132 m (-120%) |
| Station | 537 m | 919 m | -382 m (-71%) |
| Transition zone | 395 m | 109 m | 286 m (+72%) |
The total railway path is made of non commercially used portions, these portions are used for maintenance and services. They represent for the line a and the line b respectively 11.4% and 5.6% of the total length. The line b is longer than the line a by about 50%. The tunnel portions of both lines are almost equivalent between the line a (8,587 m) and the line b (8,062 m). The number of stations is same for both lines. however, the length of station railways is longer for the line b by about 30%.
The closest a point is to the green line and the closest the railway path length is to the euclidean distance. No points can be above the green line. It is impossible to have a railway path length shorter than the euclidean distance (which is the shortest distance between 2 points). This figure shows that the railway tracks between 2 stations of the line a are closer to the green line than those of the line b.
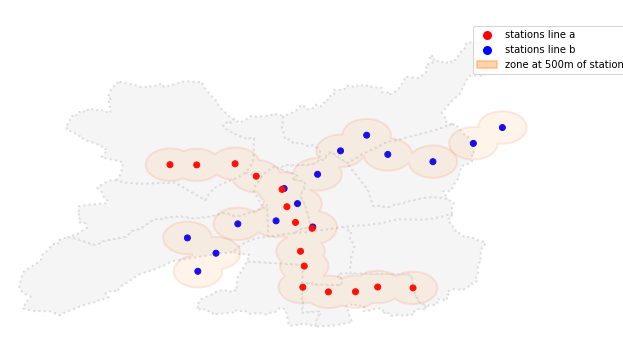
Both lines are crossing twice at the stations Gares and Saint-Anne. The line a goes across town following the axis North-East South-East while the line b follows the axis South-West North-East.
The railway paths highlight the winding shape of the lines and explains the difference between the euclidean distance and the real railways length between the stations. For example, between the stations Jacques Cartier and Clémenceau (line a) the difference is 0 m and the railway tracks are almost straight. Opposite case between the stations Gares and Saint-Germain (line b) the difference is 320 m and the railway path has along curve.
This map emphasizes the different kind of railway tracks. In town centre, there is almost exclusively tunnel due to the high density. Moving away from the centre, covered trenchs are more often used as well as viaduct more used at the end of lines.
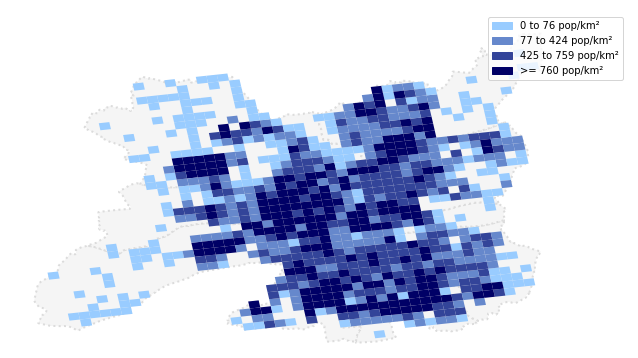
This analysis focuses on the density population compared to the stations localisation. Density data have been downloaded for 200m square side (link to data). This dataset is not complete as the total population from the data is 172,560 inhabitants while the total population of the city is about 215,000 inhabitants (2018). It can be seen on the map 5 below which areas are missing data.

The colors have been chosen based on the population density quartiles:
- 25th percentile: 77 pop/km2
- 50th percentile: 245 pop/km2
- 75th percentile: 760 pop/km2
It can be seen from map 5 the higher density in city centre and some other areas with high building like in the South.

A buffer zone of 500m radius is displayed on map 6. This buffer zone represents 14.3 km2 which is about 28% of the total area of Rennes (50.38 km2).

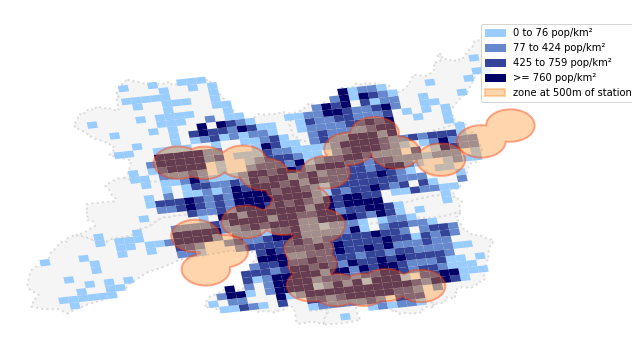
Both maps 5 and 6 are combined to highlight the localisation of the stations with the population density. With the population data used, 113,871 inhabitants
are living within 500m to an underground station. It represents about 66% of the population for the data available. Considering the total population
estimated around 215,000 inhabitants it still represents at least about 50% of the population living at 500m or less to a station. Only the population
of Rennes is taken into account while some stations of the line b are in neighbours cities(i.e. South-West and East).