The purpose of this study is to give some basic information about the population in Essex (UK county). Essex is a county in the region East of England located in the South-East of England. According to wikipedia, the population of Essex was 1,832,752 (mid-2019 est.) with an area of 3,670 km2. The data are coming from different open source platform: area boundaries and population. The analysis and visualisation are done with python using the libraries "bokeh" and "keplergl for the visualisation. All the plots are displayed as image to reduce the page loading time but they can all be interactive.
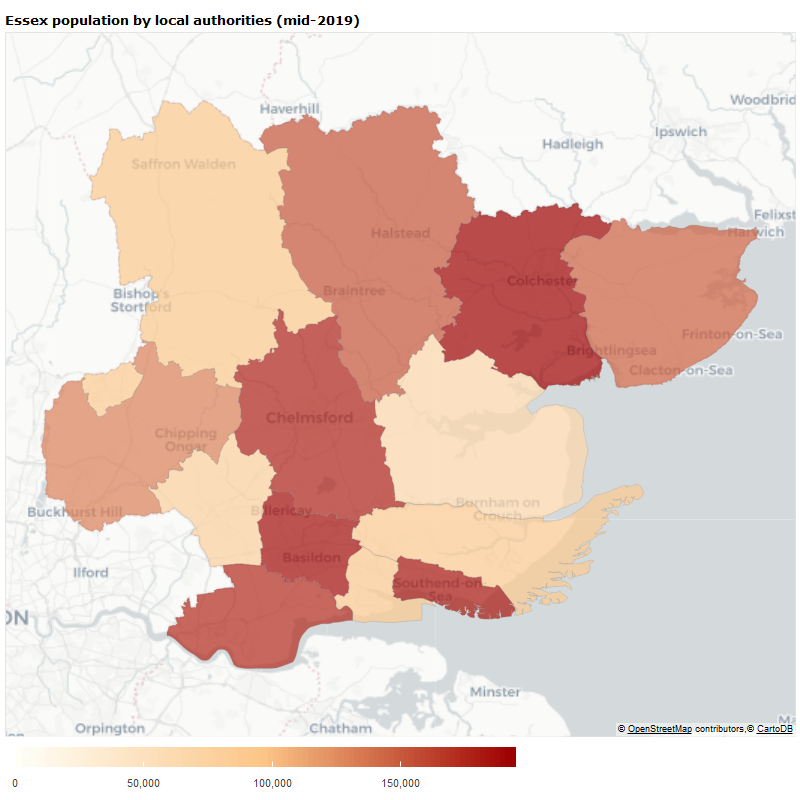
Essex is made of 14 ceremonial counties comprised of 12 non-metropolitan counties (Basildon, Braintree, Brentwood, Castle Point, City of Chelmsford, Colchester, Epping Forest, Harlow, Maldon, Rochford, Tendring, and Uttlesford) and 2 unitary authorities (Southend-on-Sea and Thurrock).
|
|
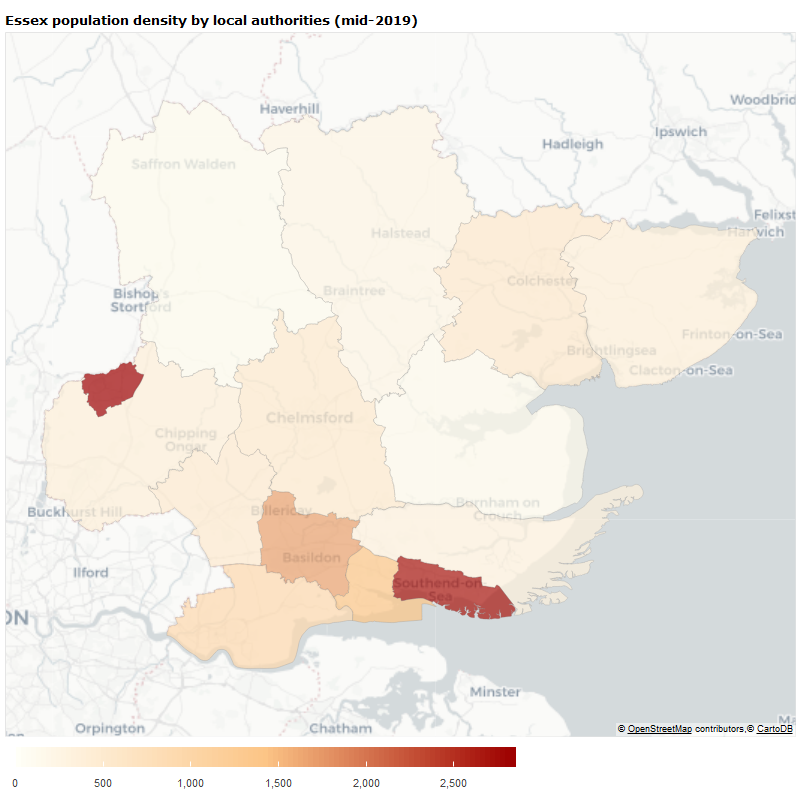
The South and North-East of Essex are the most populated parts of the county. Southend-on-Sea and Harlow are the most densely populated areas. Some areas with a sea shore have a part of their area on the sea, this leads to approximate population density calculation as these areas are uninhabitable. As next step, a smaller division of the areas must be used for a more accurate analysis.
 |
 |
 |
 |
 |
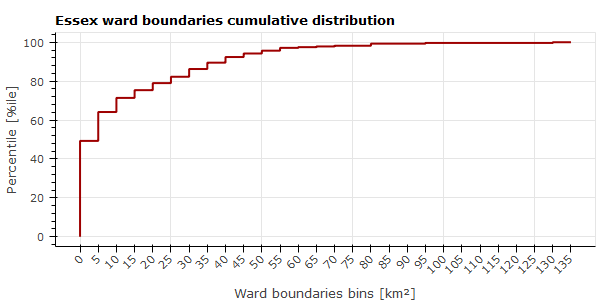 |
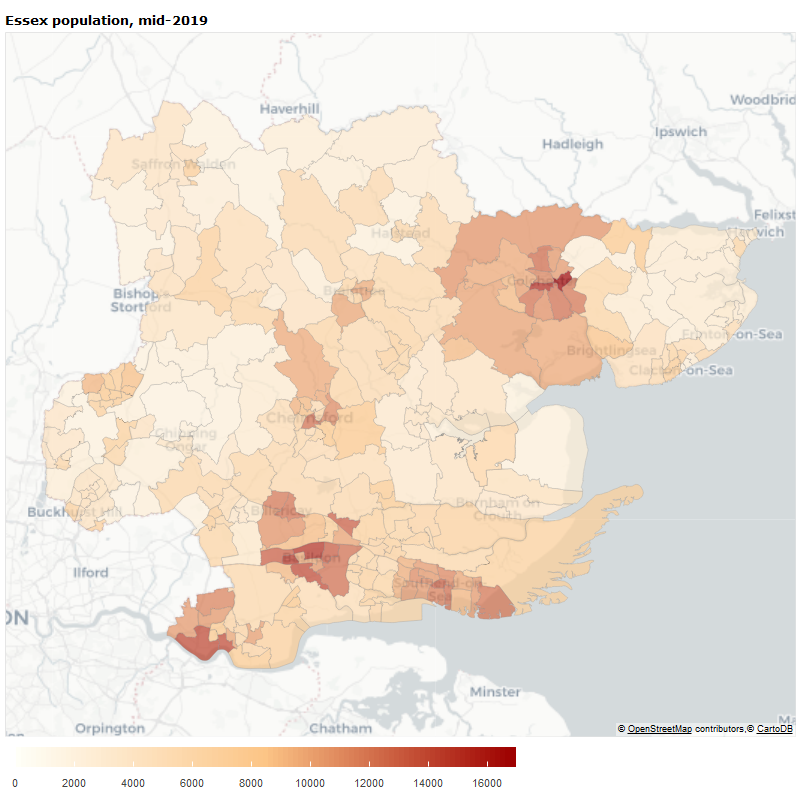
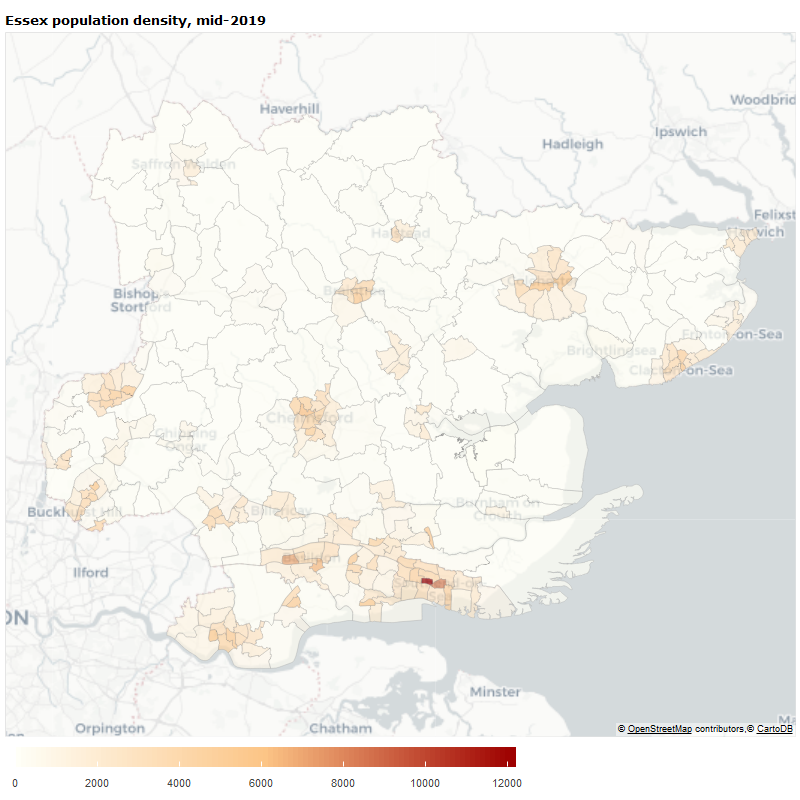
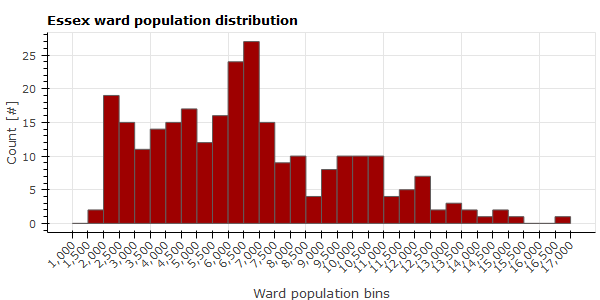
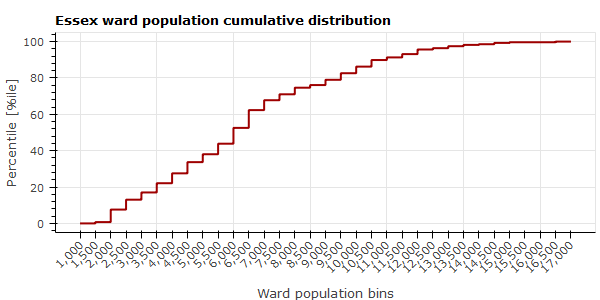
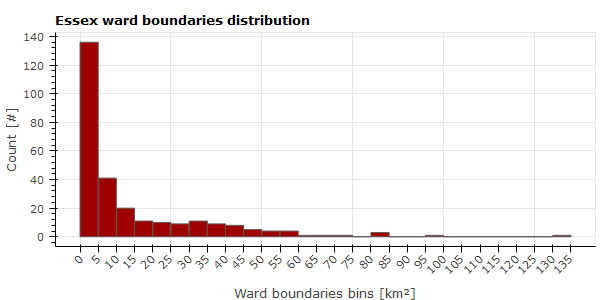
The ward population ranges from 1,920 to 16,936 inhabitants. The wards with population from 2,000 to 7,000 represent about 45% of all the ward. Around 15% of the wards have 10,000 inhabitants or more. The South and North-East of Essex are the most populated parts of the county. Some wards having a sea shore have a part of their area on the sea, similarly as above this leads to approximate population density calculation. Around 50% of the wards have an area of up to 5km2. Some areas are still much bigger than others (i.e. around Colchester), hence an even smaller area boundaries will be used as next step.
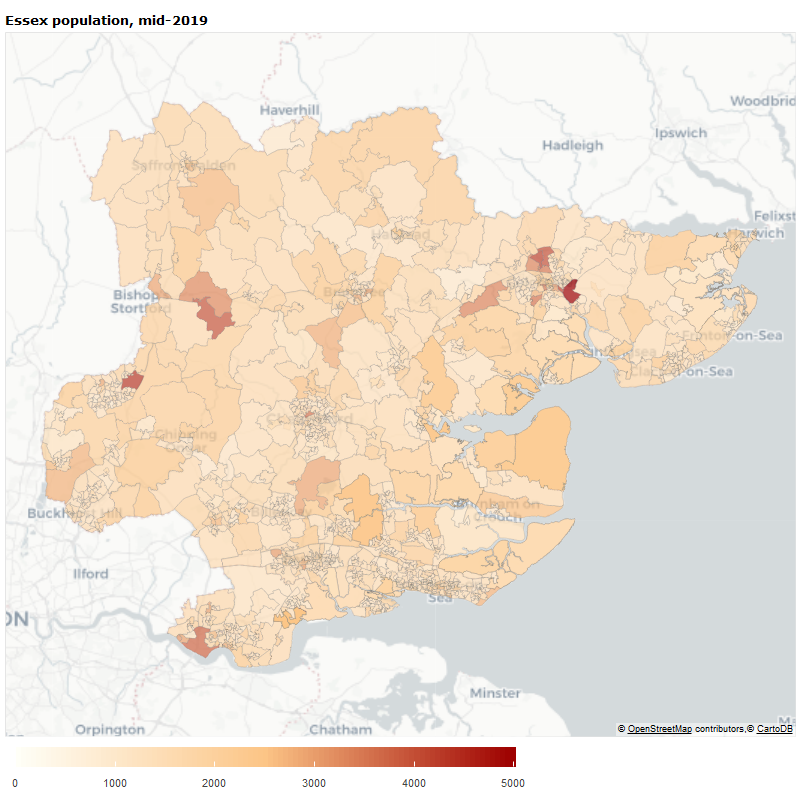
Different datasets are used in the part below. LSOA datasets are giving a total population in Essex of 1,846,655 (1,832,752 from wikipedia) and an area of 3,677 km2 (3,670 km2 from wikipedia). Datasets values are comparable to wikipedia values. The difference of area size can be due to the projection used to project the Earth surface into a 2D plane. The projection always leads to some approximation but in this case the size of LSOA is small enough to ignore the Earth curvature hence this 1% difference is ok. Regarding the population the difference is about 0.3% which is fine as well.
 |
 |
 |
 |
 |
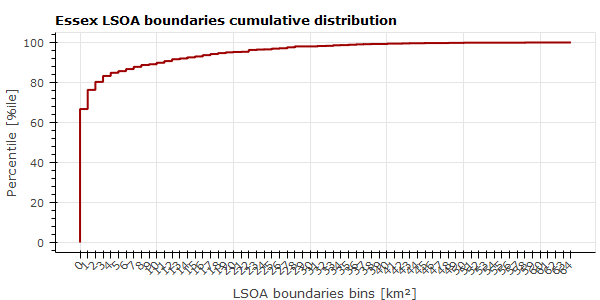 |
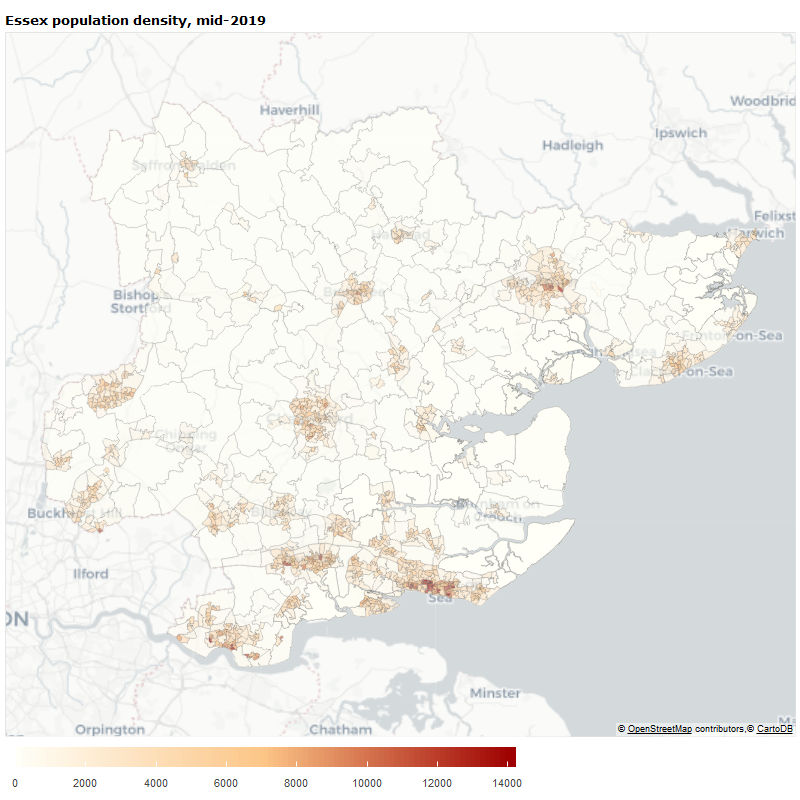
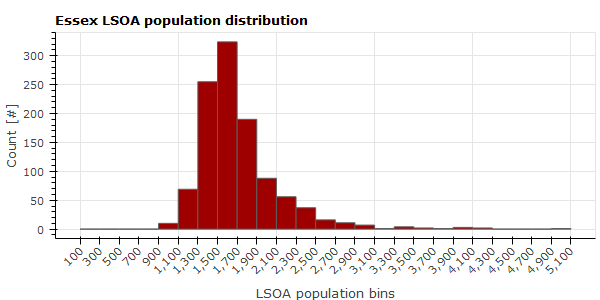
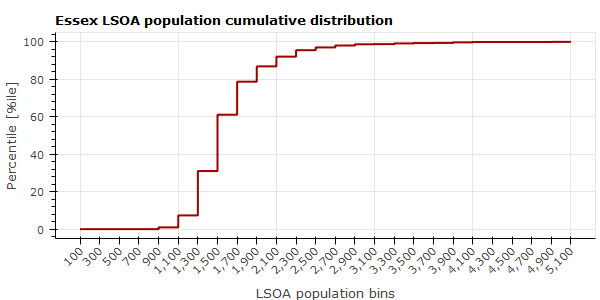
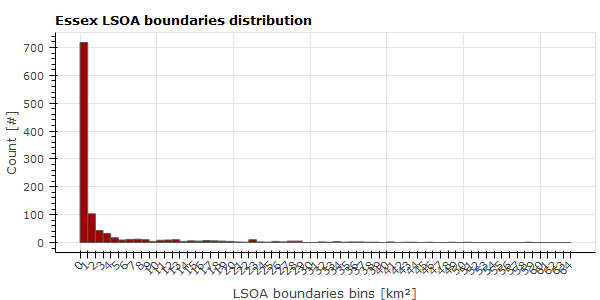
The LSOA population ranges from 987 to 5,017 inhabitants. The LSOAs with population from 1,300 to 1,900 represent about 70% of all the LSOAs. Less then 5% of the LSOAs have 2,500 inhabitants or more. With the majority of the LSOAs distributed into 3 bins, the population map shows a closed color map. Only some areas are highlighted with higher population. It can be seen from these maps and from the distribution plots that the size of LSOAs is for almost 70% of the areas less than or equal to 1km2. These small areas are especially present in densily populated urban centers. The LSOA datasets allow to identify the urban areas made of small areas densily populated.
 |
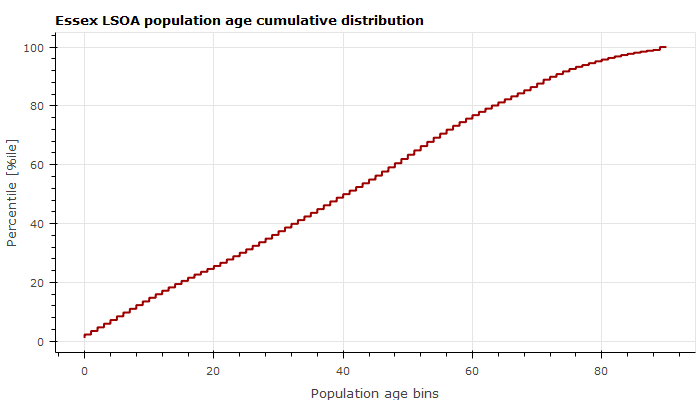 |
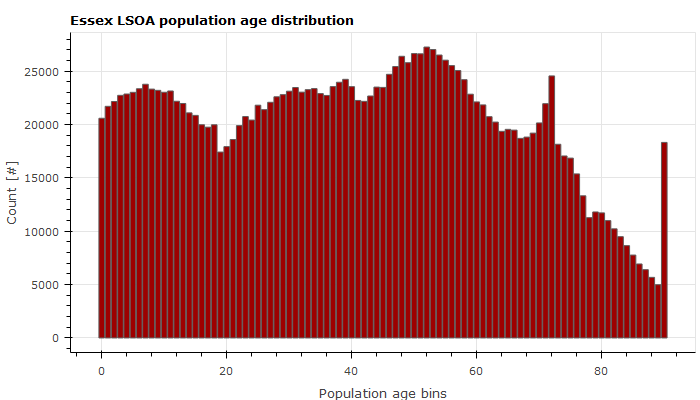
The average population in Essex is 41.15 years old and the median is slightly above 40. The people aged above 90 are all combined in the same bin that is why there is a peak in the distribution plot. Another peak is observed from the distribution plot for persons aged between 70 to 72. The reason for this peak is not explained yet, but it could be link to increase of natality after the end of WWII. There is a drop of population ranging from 12 to 19, it can be due to student pursuing their education outside Essex.
 |
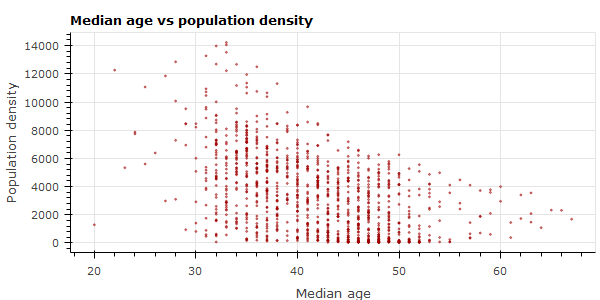 |
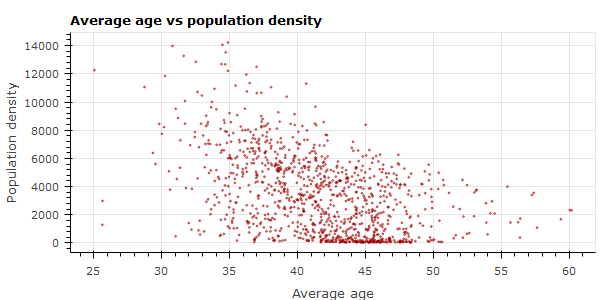
There is a small negative correlation (from -0.47 to -0.5) between average and median age vs population density. If this is true, it should be seen on a map that the most densly populated LSOA are also the ones with the lowest average/median age. The median age is rounded to the nearest integer.
 |
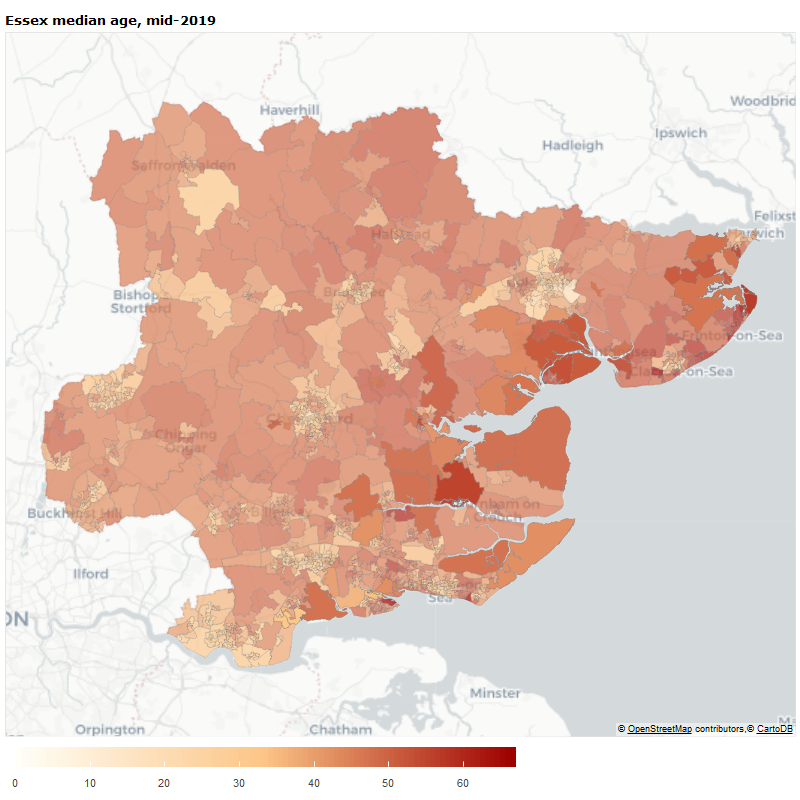 |
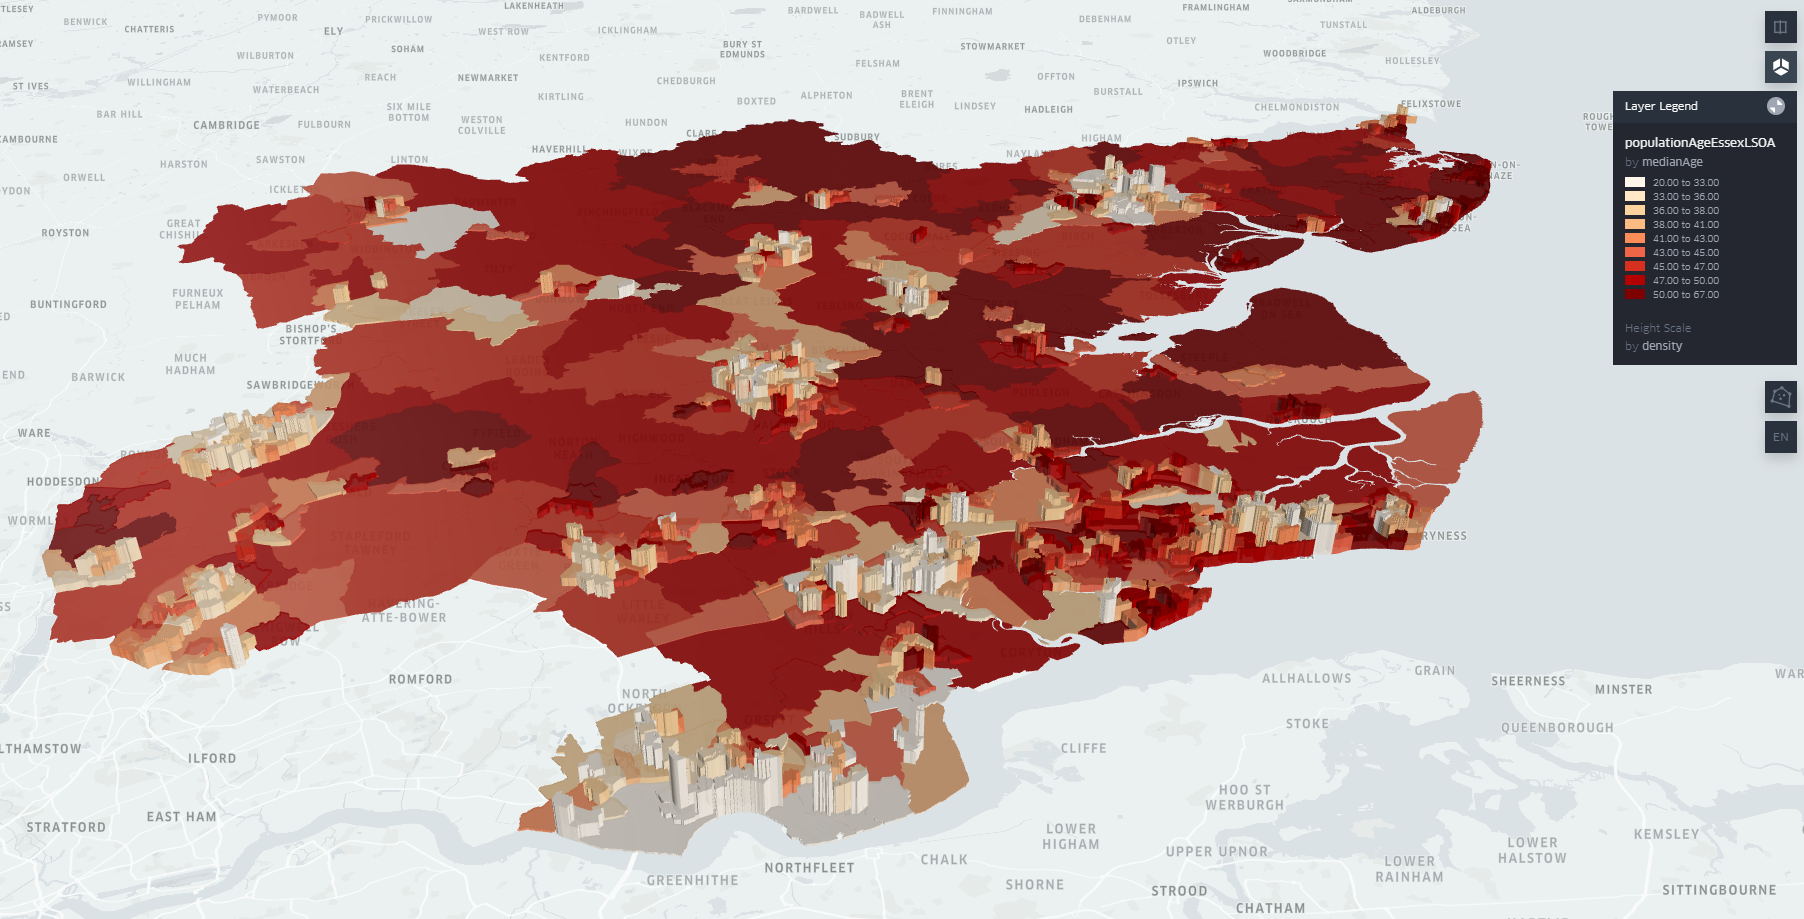
As highlighted with the correlation calculation, it can be seen that the most densely population areas are usually the ones with the lowest average or median age. To highlight this another visualisation, in 3D, enables to confirm this trend which is however not always true. The elevation represents the density (the higher the more densely populated) and the color scale represents the median age (the darker the higher).
The graph above shows the population in Essex per age and per year from 2001 to 2017. The plot highlights a population decrease around 18 years old which is probably due to the student continuing their studies or start working in another county. In 2001, there is a gap between the ages 81-82, it is very likely to be one the consequence of WWI on the population. The effect of WWII could also be seen between the ages 59-60, at the beginning of the conflict, when the natality decreases, and between the ages 54-55 when the natality increases post-war. The aging of the population can be observed when looking at the persons aged of 90 or more which value is always increasing from about 10,900 in 2001 to 17,800 in 2017.