The purpose of this study is to suggest charging station locations in residential areas. The locations will be given for Basildon borough. Few preliminary steps are required including: 1) Data acquisition and pre-processing, 2) baseline analysis, 3) ULEV forecast, 4) charging station locations model and location definition. The data are coming from open source data such as gov.uk, geoportal.statistics.gov.uk, chargepoints.dft.gov.uk, osdatahub.os.uk, openstreetmap.org. The data are pre-processed and stored locally either as dataframe or geodataframe, no database is required as the amount of data is not big enough. The tools used are python and QGIS.
This part aims at understanding what the situation in two places is regarding the number of ULEV (Ultra Low Emission Vehicle) and charging infrastructure. This is
achieved with data exploratory and visualisation of the pre-processed open-source data. The baseline analysis focuses on two areas: Essex County (part of East region)
and Basildon borough (part of Essex County).
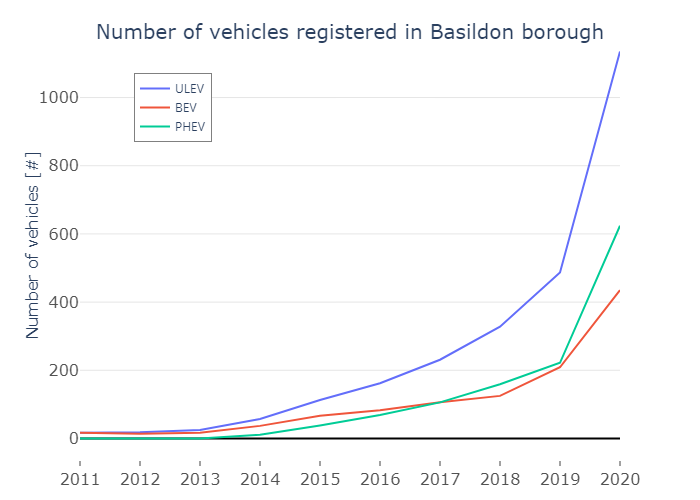
A sharp increase of ULEVs registered in Basildon borough is observed in last years. From 17 ULEVs in 2011 it increases to 1,135 ULEVs in 2020. The absolute number is
not sufficient hence the percentage of ULEVs considering all cars is calculated. A similar exponential increase is observed but ULEVs represent only 1.13% of all cars
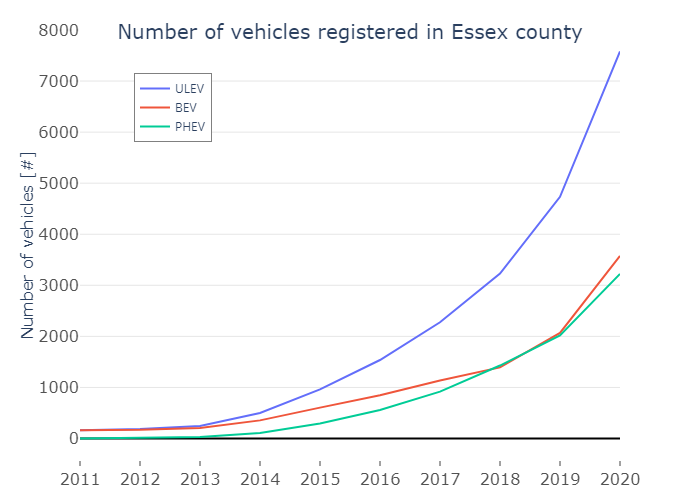
as of 2020. At the Essex County level, a similar ULEVs registered trend can be seen. From 160 ULEVs in 2011, it increases to 7,579 ULEVs in 2020. The percentage of
ULEV considering all cars is also calculated and is smaller than Basildon borough. In 2020, the ULEVs represent only 0.78% of all cars in Essex.
 |
 |
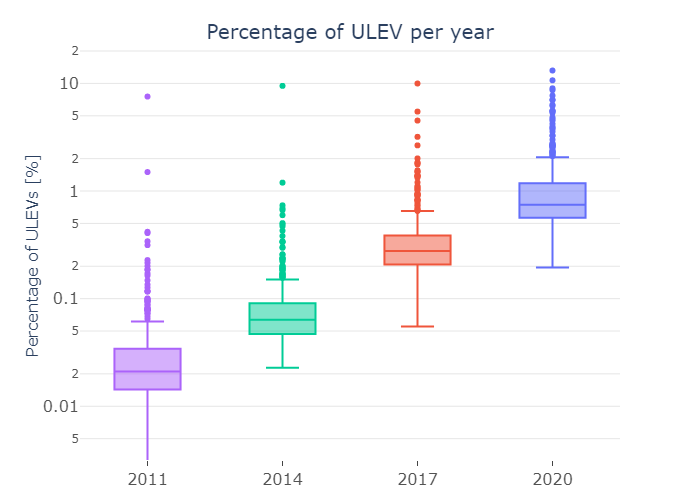
The trend observed for a borough and a county may be only local trends. To check whether this statement is true or false, the percentage of ULEVs for each administrative tier (e.g., Local Authorities (LA), regions, counties, metropolitan area) is calculated and results given in figure below. The boxplot figure highlights a continuous increase in the percentage of ULEVs in the UK globally. Mind the y-axis which uses logarithmic scale. The median value went up from 0.02% in 2011 to 0.75% in 2020. The minimum value raised from 0% in 2011 to 0.19% in 2020. These values remain low, but the increasing trend can be perceived.
The increasing trend of ULEV percentage in not only local but global trend in the UK. The animated figure below shows a scatter plot of ULEV number versus cars number again for each administrative tier available from 2011 to 2020. Three dashed lines have been added as guidelines to quickly identify the performance of each area. Mind the axis which use logarithmic scale. For 2020, the majority of points are below the 5% line and about 65% of the area have 1% or less. Only 2 areas are above 10% (Slough and City of London) and about 10 areas between 5 and 10%.
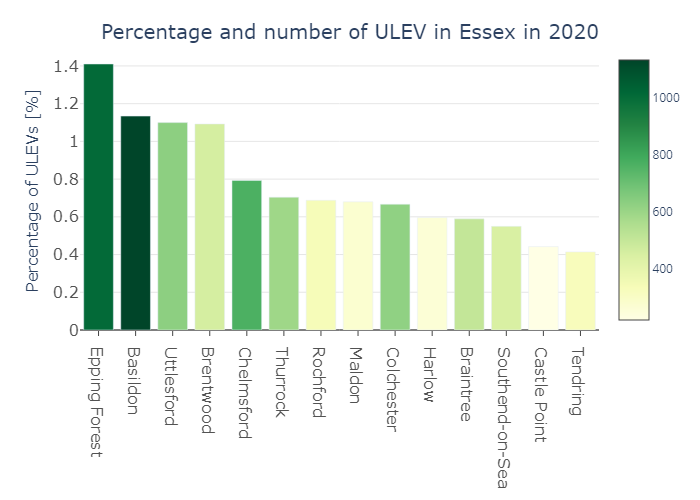
Essex ceremonial county is made of 12 boroughs and 2 unitary authorities (Southend-on-Sea and Thurrock). Basildon borough is the second one in terms of ULEV percentage but the first one in terms of absolute number of ULEVs. Epping Forest is the only one that out-performs Basildon in term of ULEV percentage. Only four boroughs have more than 1% of ULEV amongst all cars, all the other are between 0.4 and 0.8%.
Locally, Basildon performs well compared to its county boroughs in terms of ULEV percentage, 1.13%, but is doing less than the region (East) and country (England) average respectively 1.40% and 1.43%. However, the increase of absolute number of ULEV over the last 5 years is higher in Basildon than in other bigger areas, around 900% increase versus 560 to 680% increase. The last 5 years increase shows a trend towards a future match up with the higher average values. About Essex County, compared with regional and national average, Essex is up to 0.6% less in terms of ULEV percentage. The last 5 years increase shows a similar number of ULEV increase than England (around 680%) which is not a good sign of quick ULEV percentage catching up.
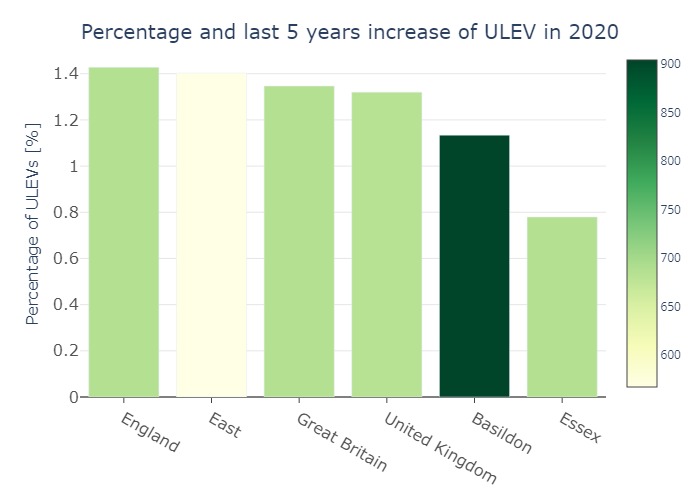
The general trend goes towards an increase of the ULEVs number as well as percentage. This increase varies within the UK areas due to various factors, such as revenue or access to a good charging infrastructure network.
The lack of charging stations is often mentioned as one of the main roadblocks for further BEV and PHEV uptake. The charging stations datasets pre-processed is now
explored. The data used here were up to date as of November 2021. The datasets do not contain a consistent value that would give information about when the charging
stations have been installed. The only value that contains a date could refer to the date the charging stations have been built or ready to be used or added to the
dataset. It is very likely to be the date when charger information has been added to this dataset as there is a peak in the date which is not realistic compared with
other sources that give the number of charging stations installed per year. For this reason, the number of charging stations over the years cannot be done accurately,
therefore the following analysis consider nowadays situation.
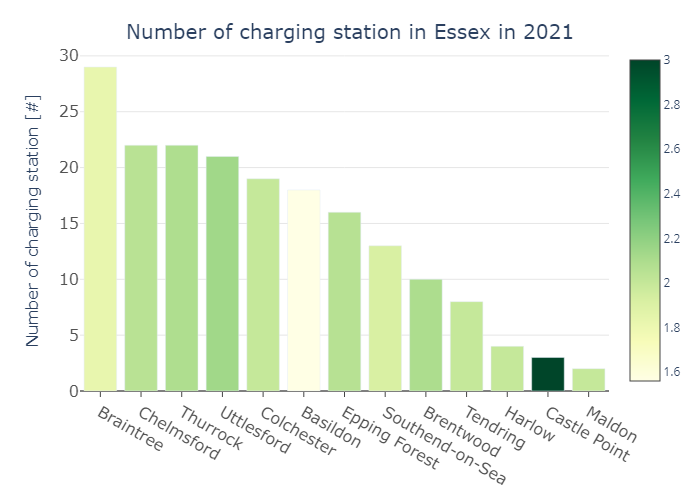
In Basildon, there are 18 charging stations and 28 connectors (1.56 connectors/stations). Essex has 187
charging stations and 371 connectors (1.98 connectors/stations). Braintree is the borough with the highest number of charging station (29) while Maldon has the lowest
(2). Basildon is a bit higher than the average number of charging stations with 18 stations. However, it has the lowest ratio number of connectors per station (1.56).
Castle Point has only 3 charging stations but each of them has 3 connectors meaning up to 9 vehicles can charge simultaneously.
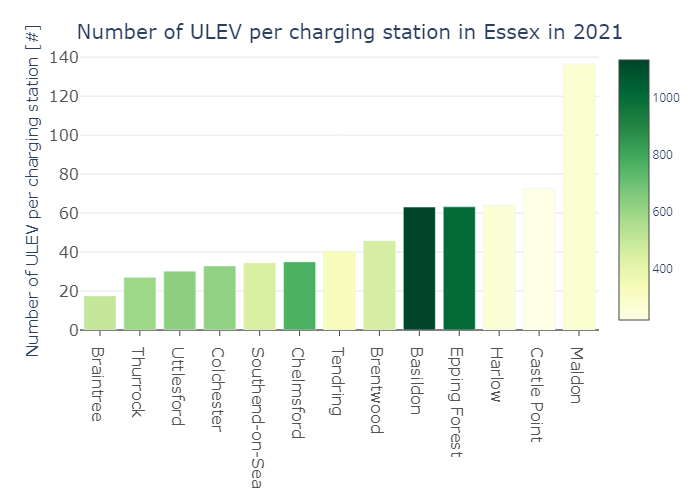
The locations of charging stations should match with the location of ULEVs to ensure the charging demand can be met. The figure below displays the ratio number of ULEV per charging stations in Essex. The areas that perform the best are the one with the smallest ratio. The darker colour and the smaller the bar are the better, it means there are a lot of ULEVs and many charging stations within the area. Basildon and Epping Forest have the highest number of ULEV but the ratio per charger is about 3 times higher than the lowest in Essex (63 > 17). Maldon is performing the worst with only 2 charging stations for 273 ULEVs.
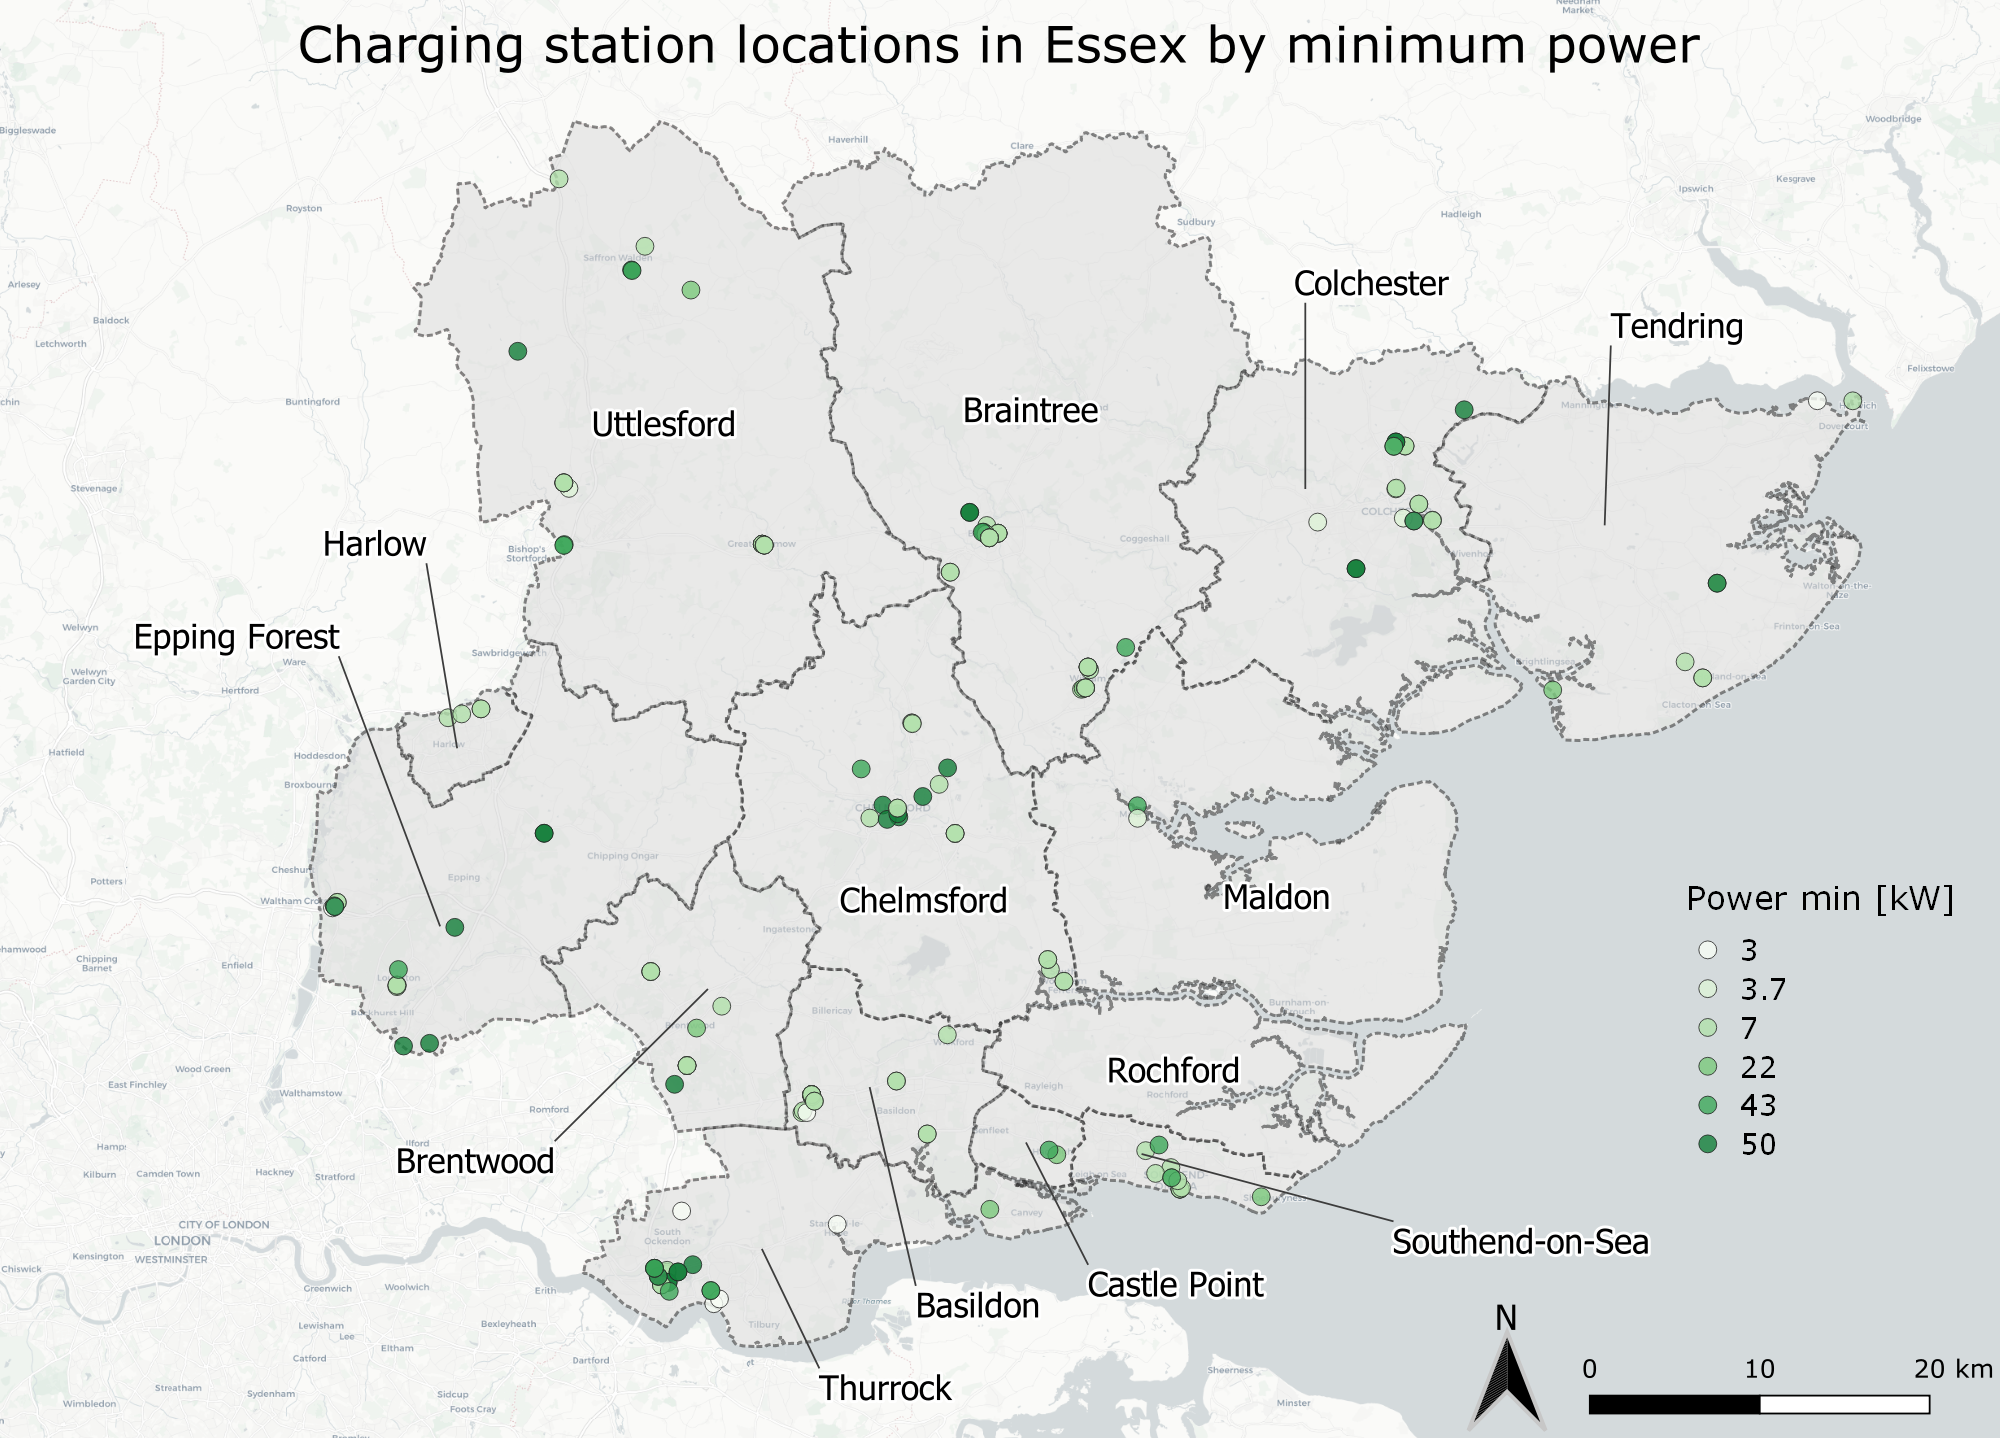
The map below depicts the location of the charging stations in Essex. Some points located very close from each other’s cannot be clearly identified on the map. Each colour represents the minimum power available per charging stations. In some stations made of multiple connectors, it can be found different power. Here the worst case is taken considering the lowest power available. Few clusters can be seen on the map, they are most of time matching with the major town centre such as Colchester, Chelmsford, Thurrock, or Southend-on-Sea. However, Basildon which is the fourth largest city does not have a similar charging stations cluster.
The purpose of this part is to forecast the number of ULEVs in the next years until 2050 for 3 scenarios: baseline (based on government petrol and diesel vehicles ban policy), low (assuming 20% increase every year), and high (opposite behaviour as low scenario). The forecast of ULEV is key to define a charging infrastructure development plan that is suitable according to the charging demand led by the number and location of ULEVs.
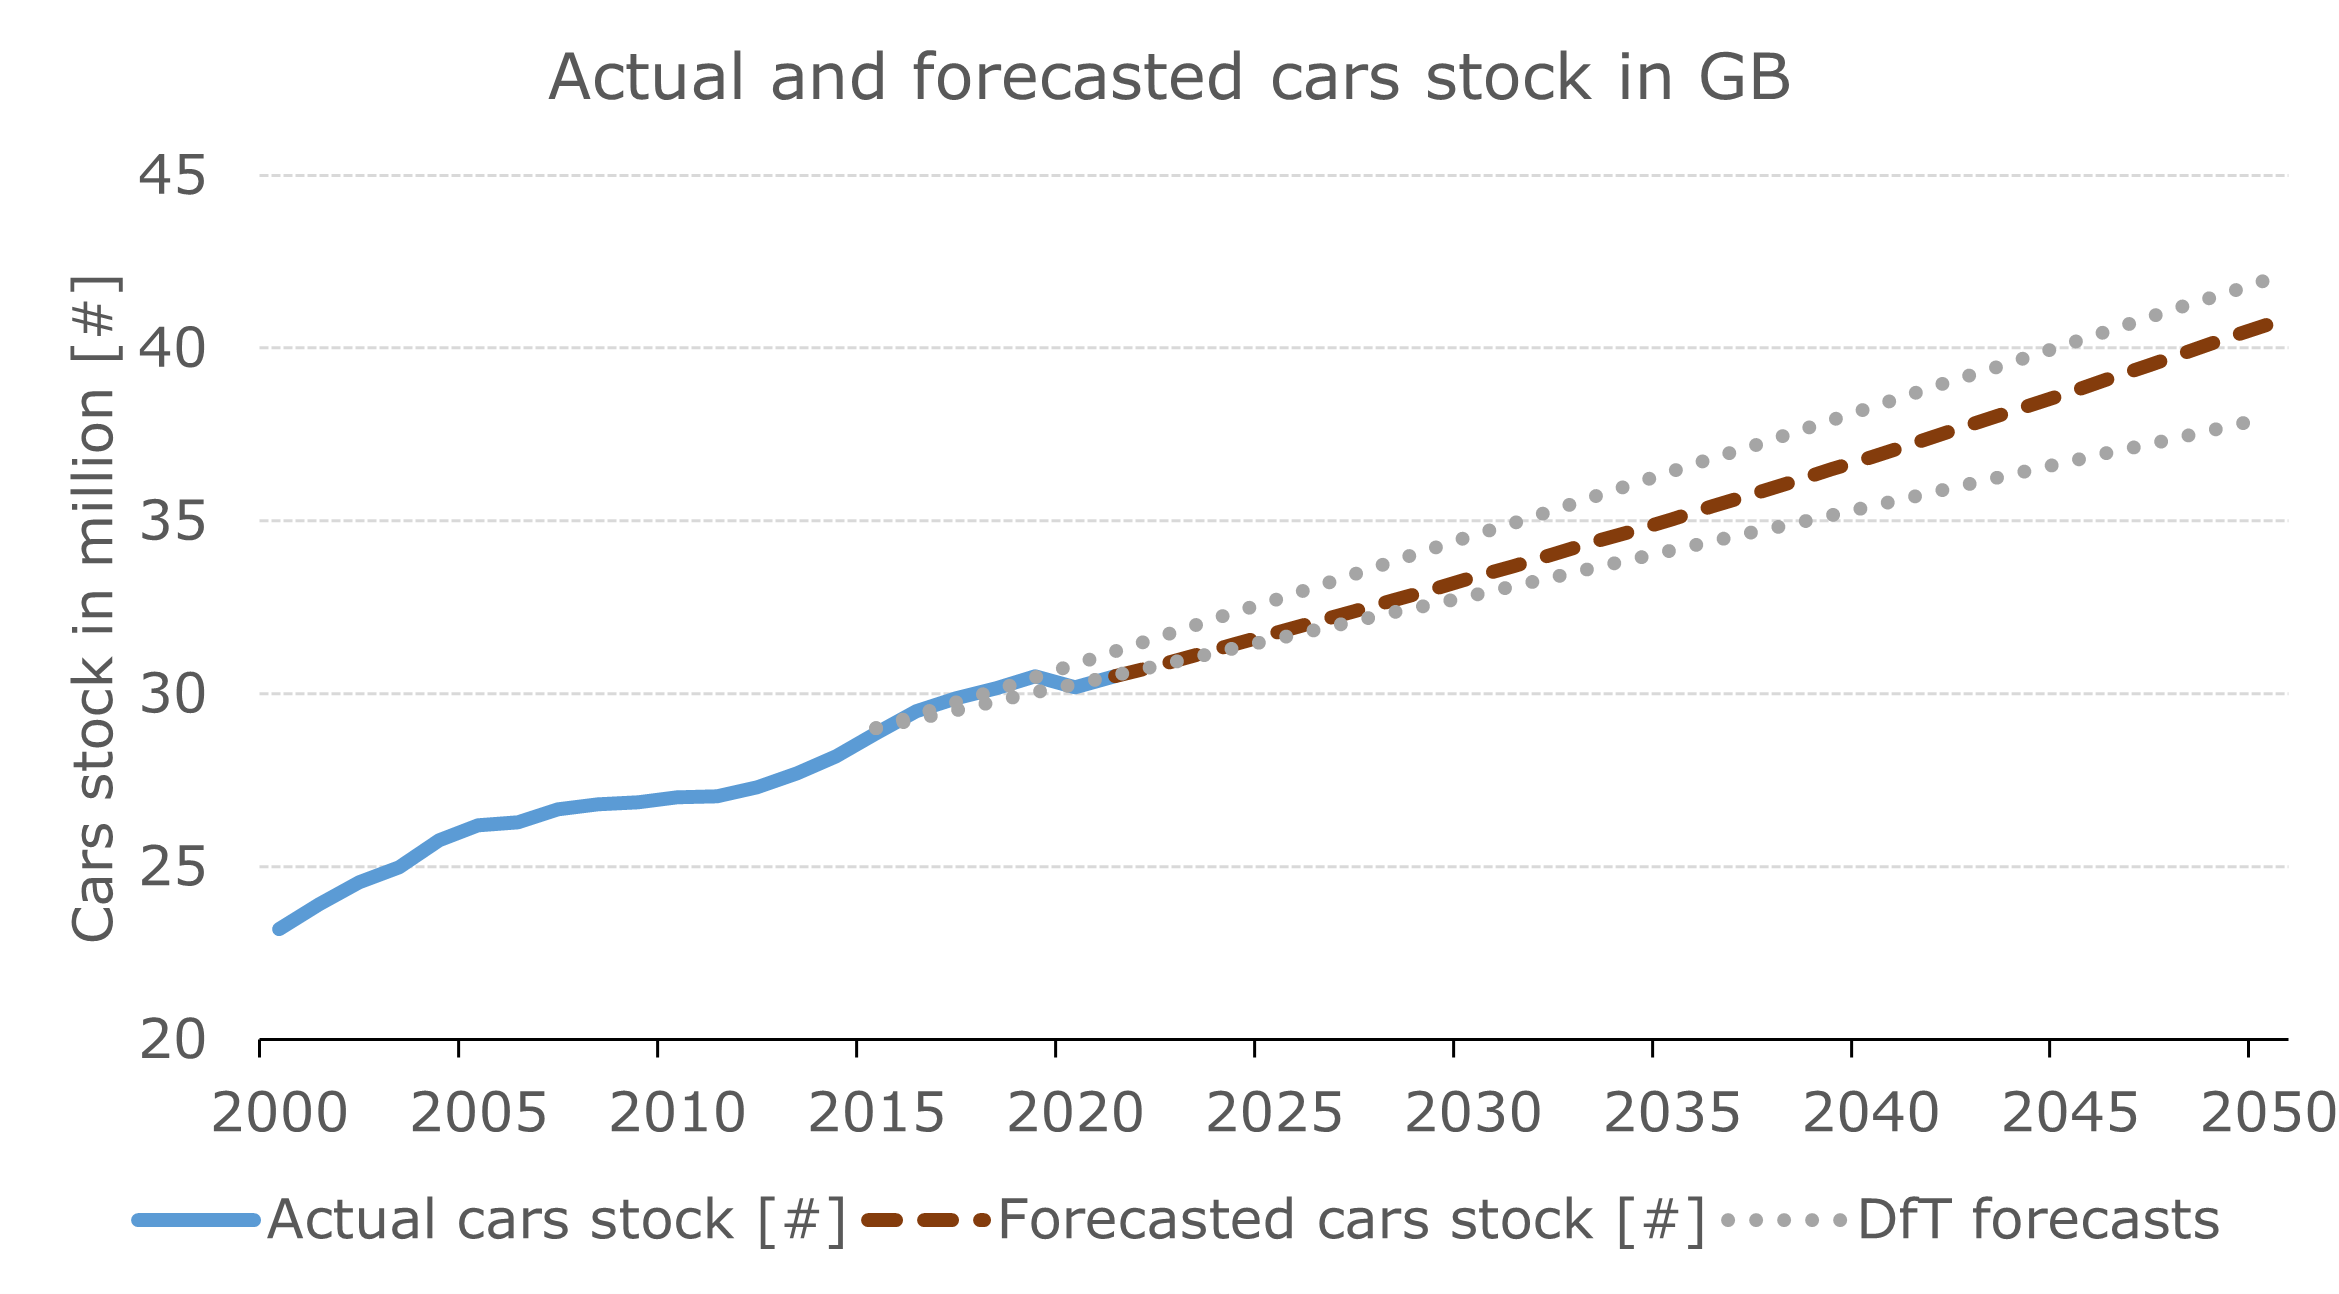
A 2018 Department for Transport (DfT) report forecasts an increase of 30% to 45% of car ownership from 2015 (29 million) to 2050 (38 to 42 million) in England and
Wales. From the data analysed, the average and median cars stock increase is 1% for the last 15 years. Assuming 1% increase per year, it is predicted to have 40.7
million of cars in 2050 in GB which is within the range predicted by DfT. The data available were for GB which includes Scotland on top of England and Wales, that
explains the estimation from the data slightly closer to the higher range from DfT report.
ULEV category does not only include cars but also LGV, and HGV. Cars
represents the majority of ULEVs hence cars and vehicles (cars + LGV + HGV) categories are assumed to follow the same trend.
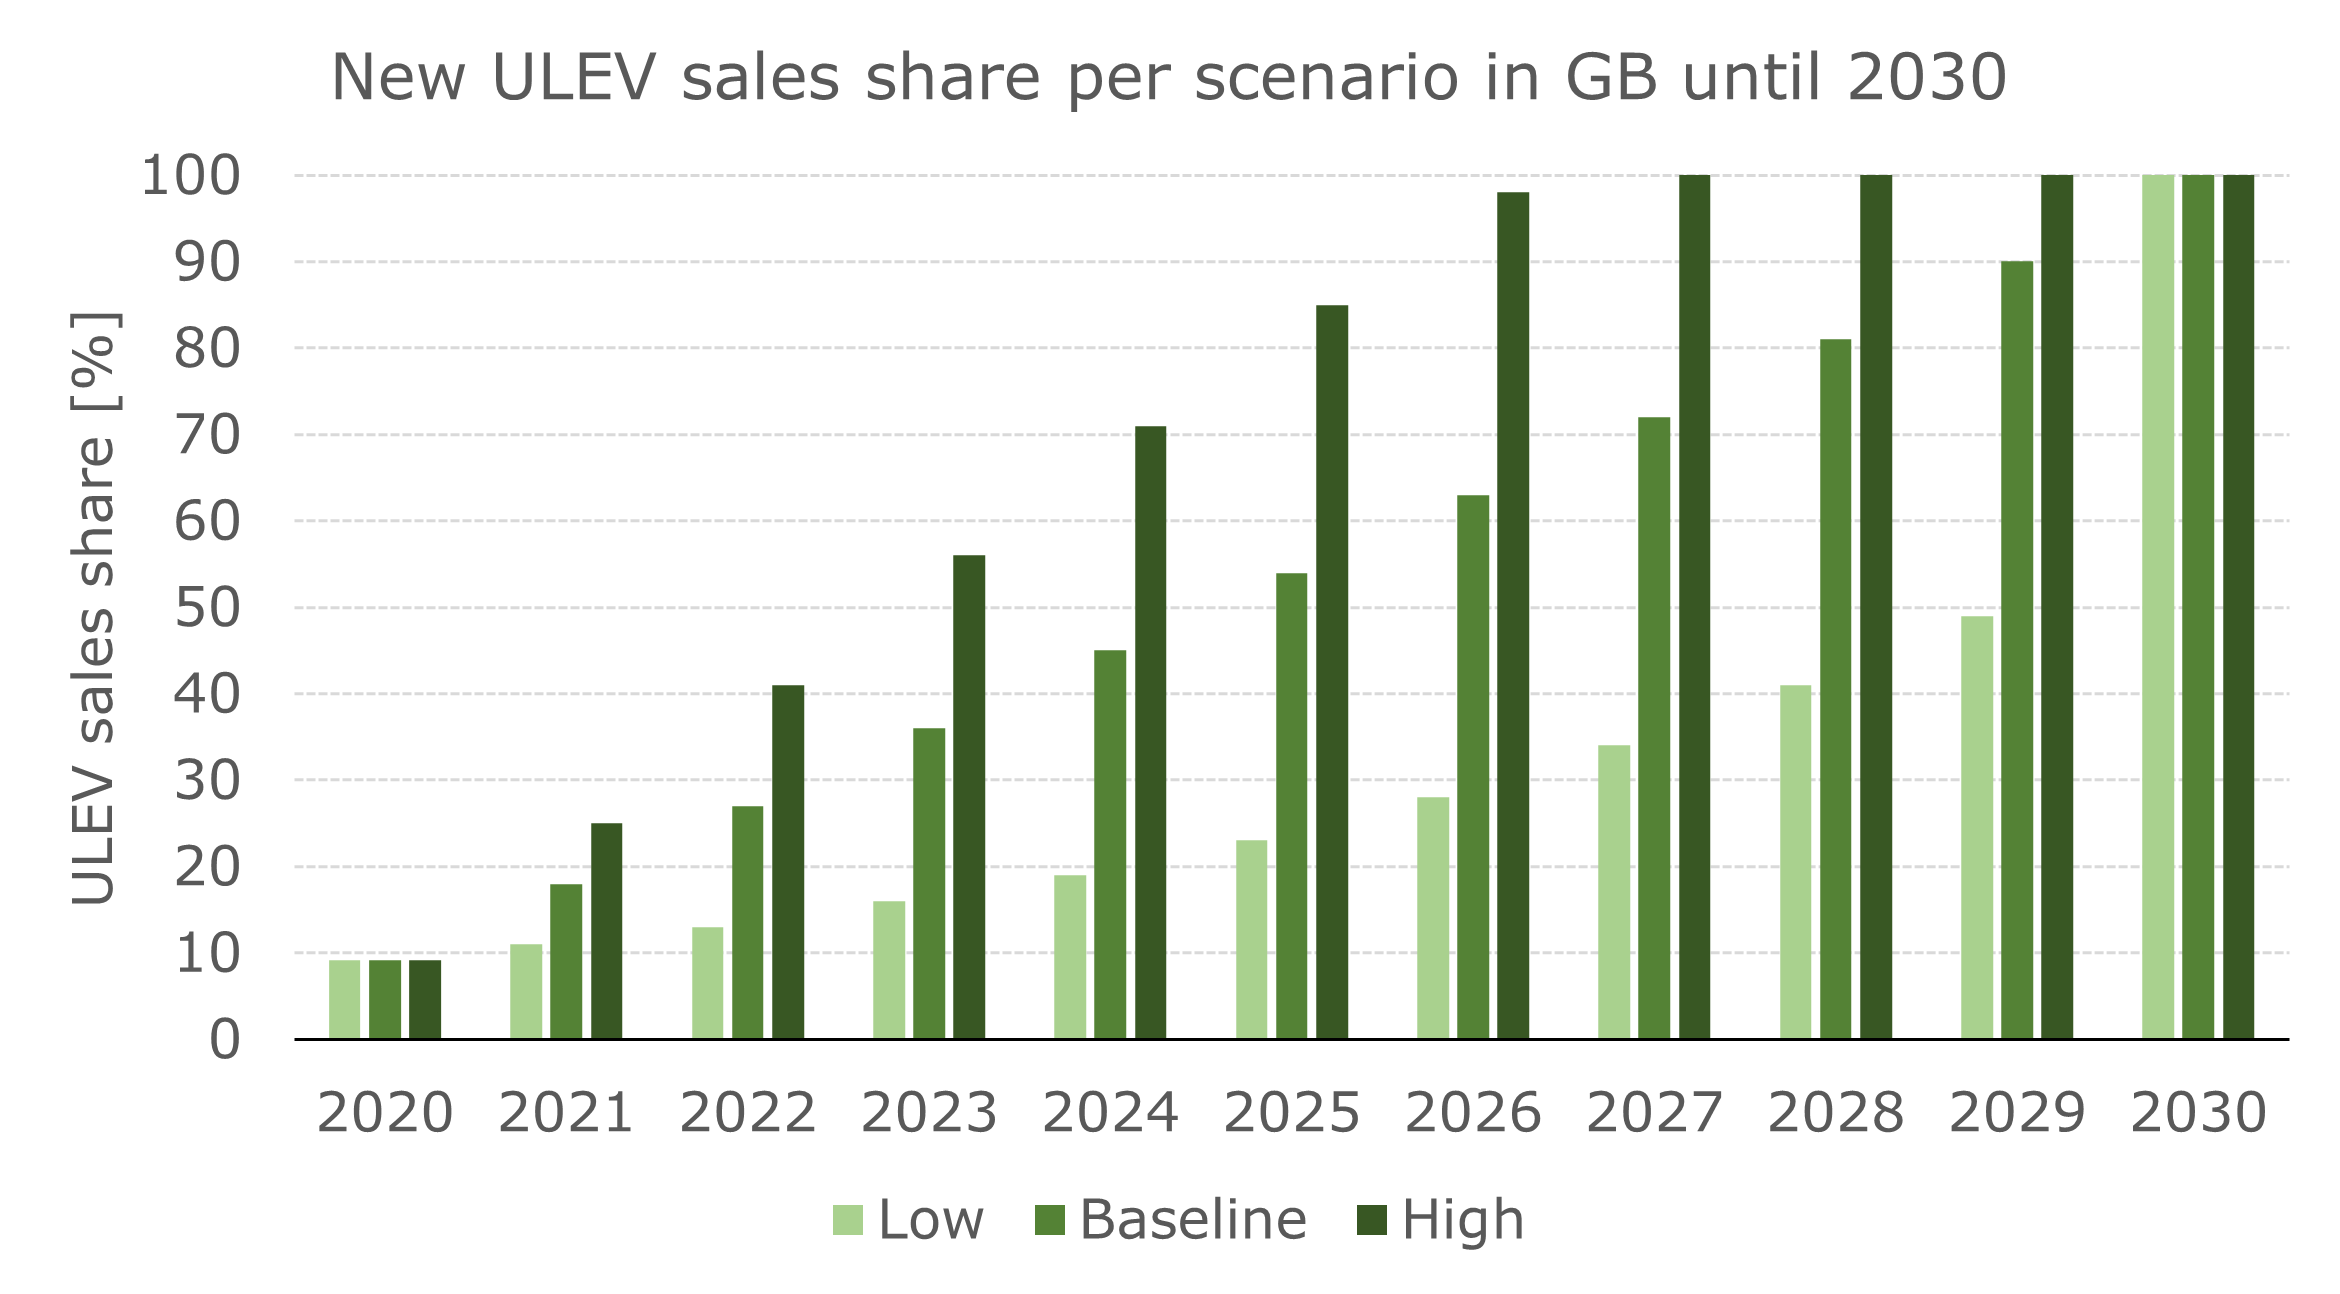
The British government announced to ban petrol and diesel cars and vans sales by 2030 and hybrid and PHEV by 2035. In 2030, 100% of new cars and vans sales will be only ULEV (BEV or PHEV). The government measures to tackle road pollution can be used as targets for the sales scenario. The forecasted new cars and vans ULEV sales can be interpolated between 2020 actual data and 2030 when only new BEV or PHEV cars and vans could be sold. Baseline scenario assumes a linear interpolation. Low scenario assumes 20% increase from the previous year to stay close to the current growth. High scenario assumes the opposite behaviour as low scenario.
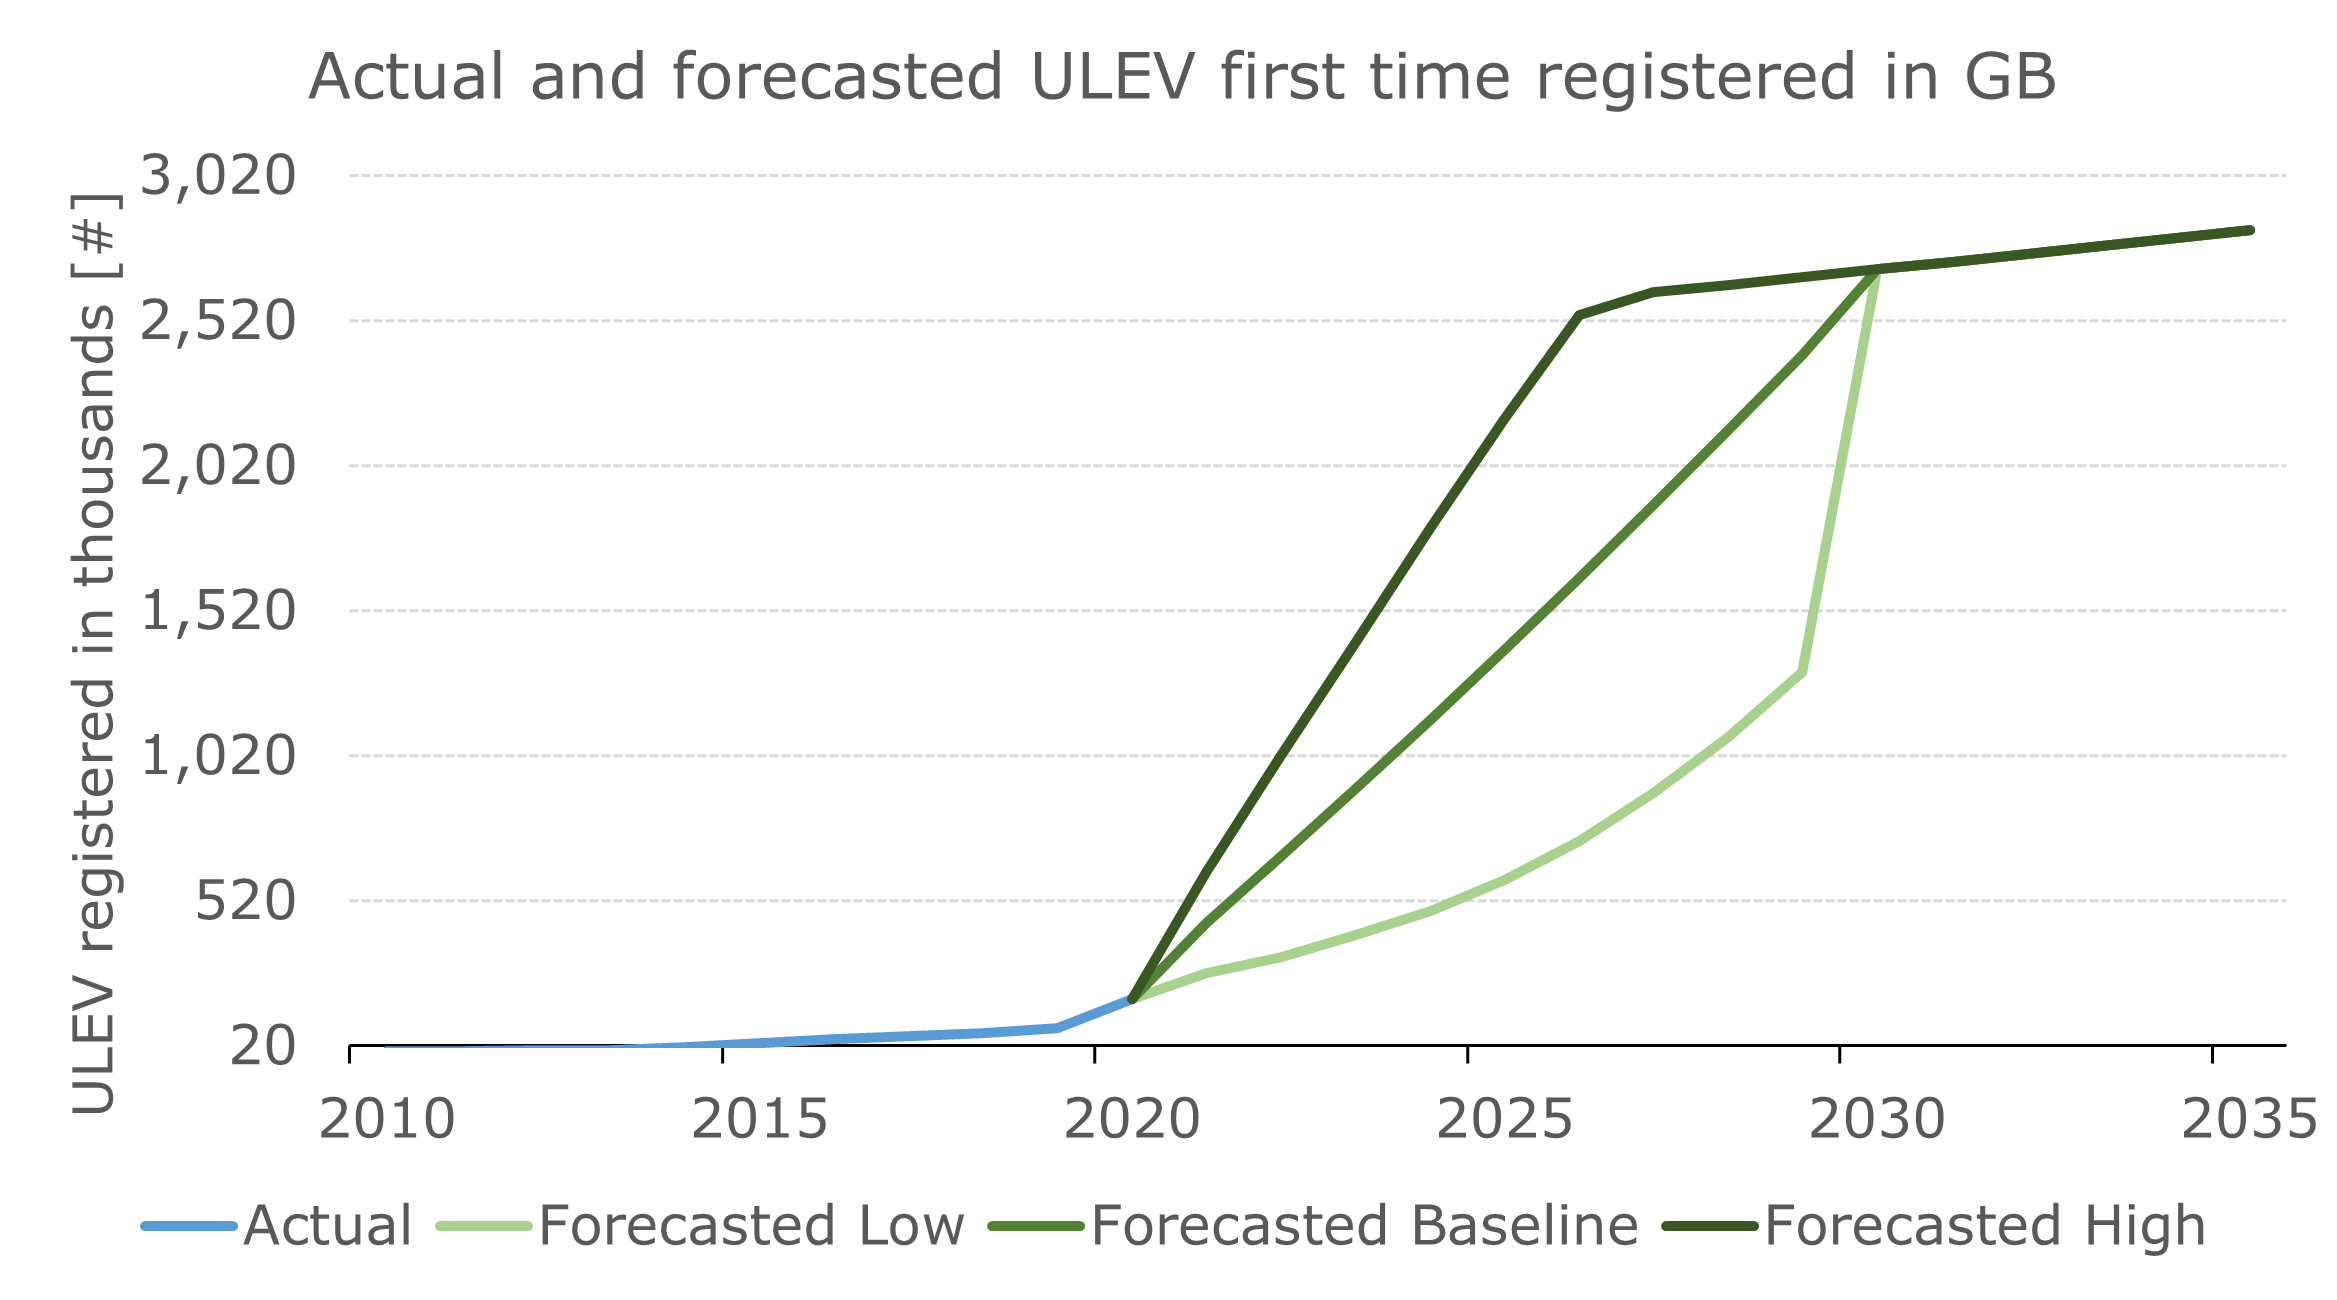
The number of first-time registered vehicle is calculated using the predicted vehicle stock and scrappage value previously calculated. The scrappage rate is based on data and the rate of scrappage is assuming to increase by 1% per year. From 2030, all the scenarios predict the same amount of ULEV registered for the first-time due to the government ban. The baseline scenario growth is linear while the low scenario starts growing at moderate rate before a high increase between 2029 and 2030 to follow the regulation. High scenario shows a quicker uptake until 2027 when the new ULEV sales reach 100%.
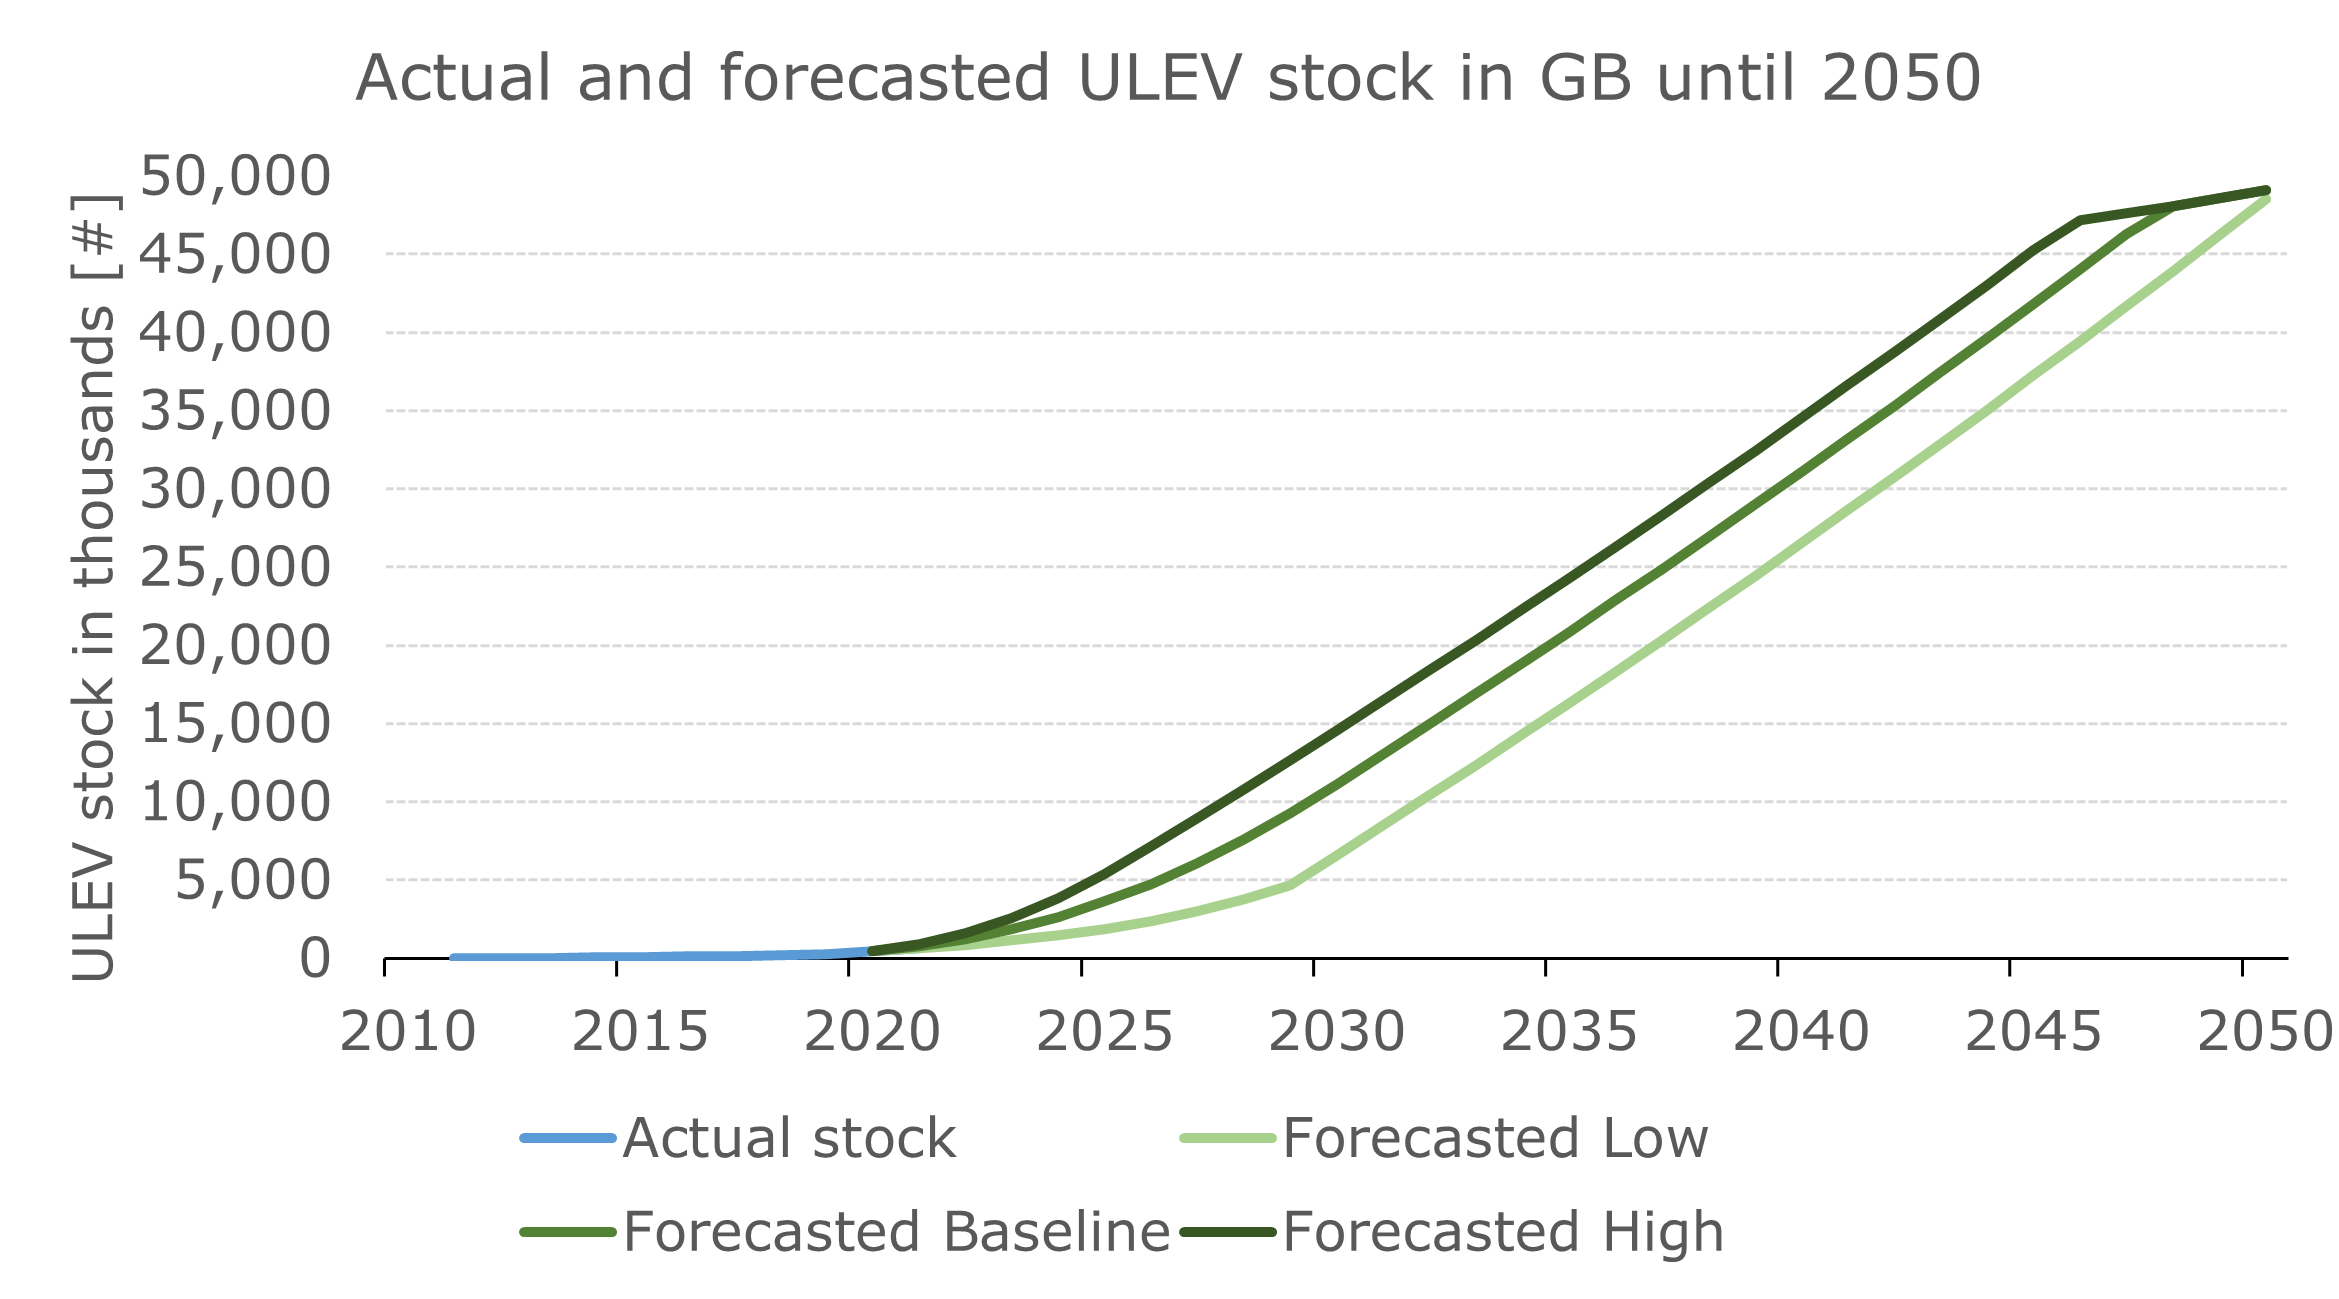
In 2025, it is forecasted between 1.8 and 5.3 million ULEVs on the road compared to 0.4 million in 2020. When petrol and diesel sales ban will be effective in 2030, it is forecasted between 6.5 to 14.5 million ULEVs registered. The high scenario predicts 100% of ULEV by 2046 while the low scenario projects 100% ULEV after 2050.
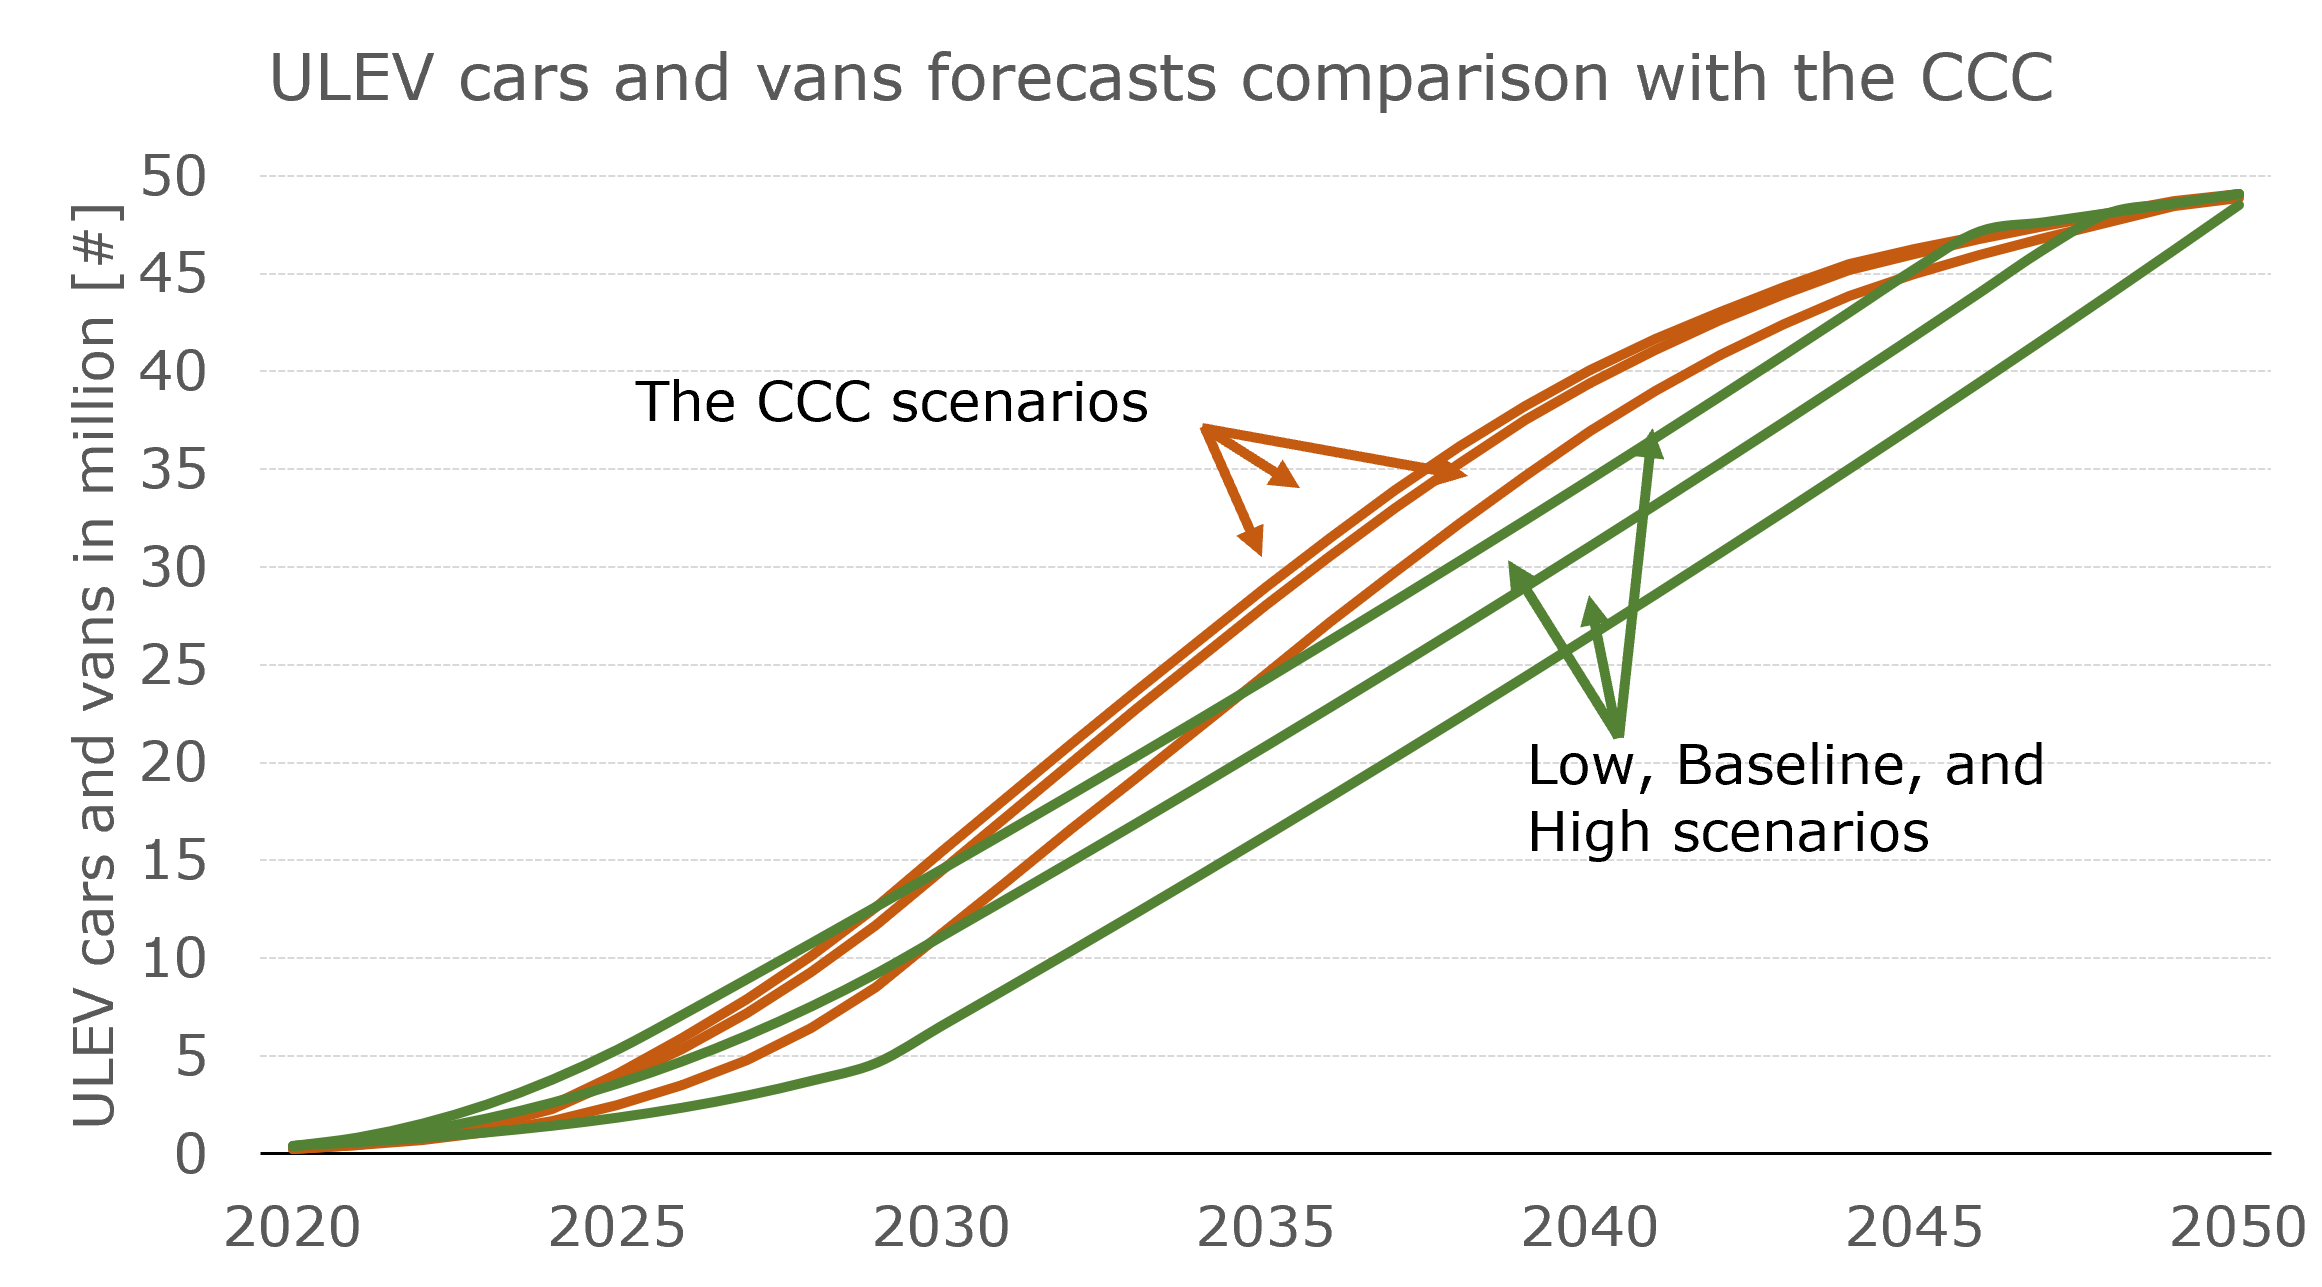
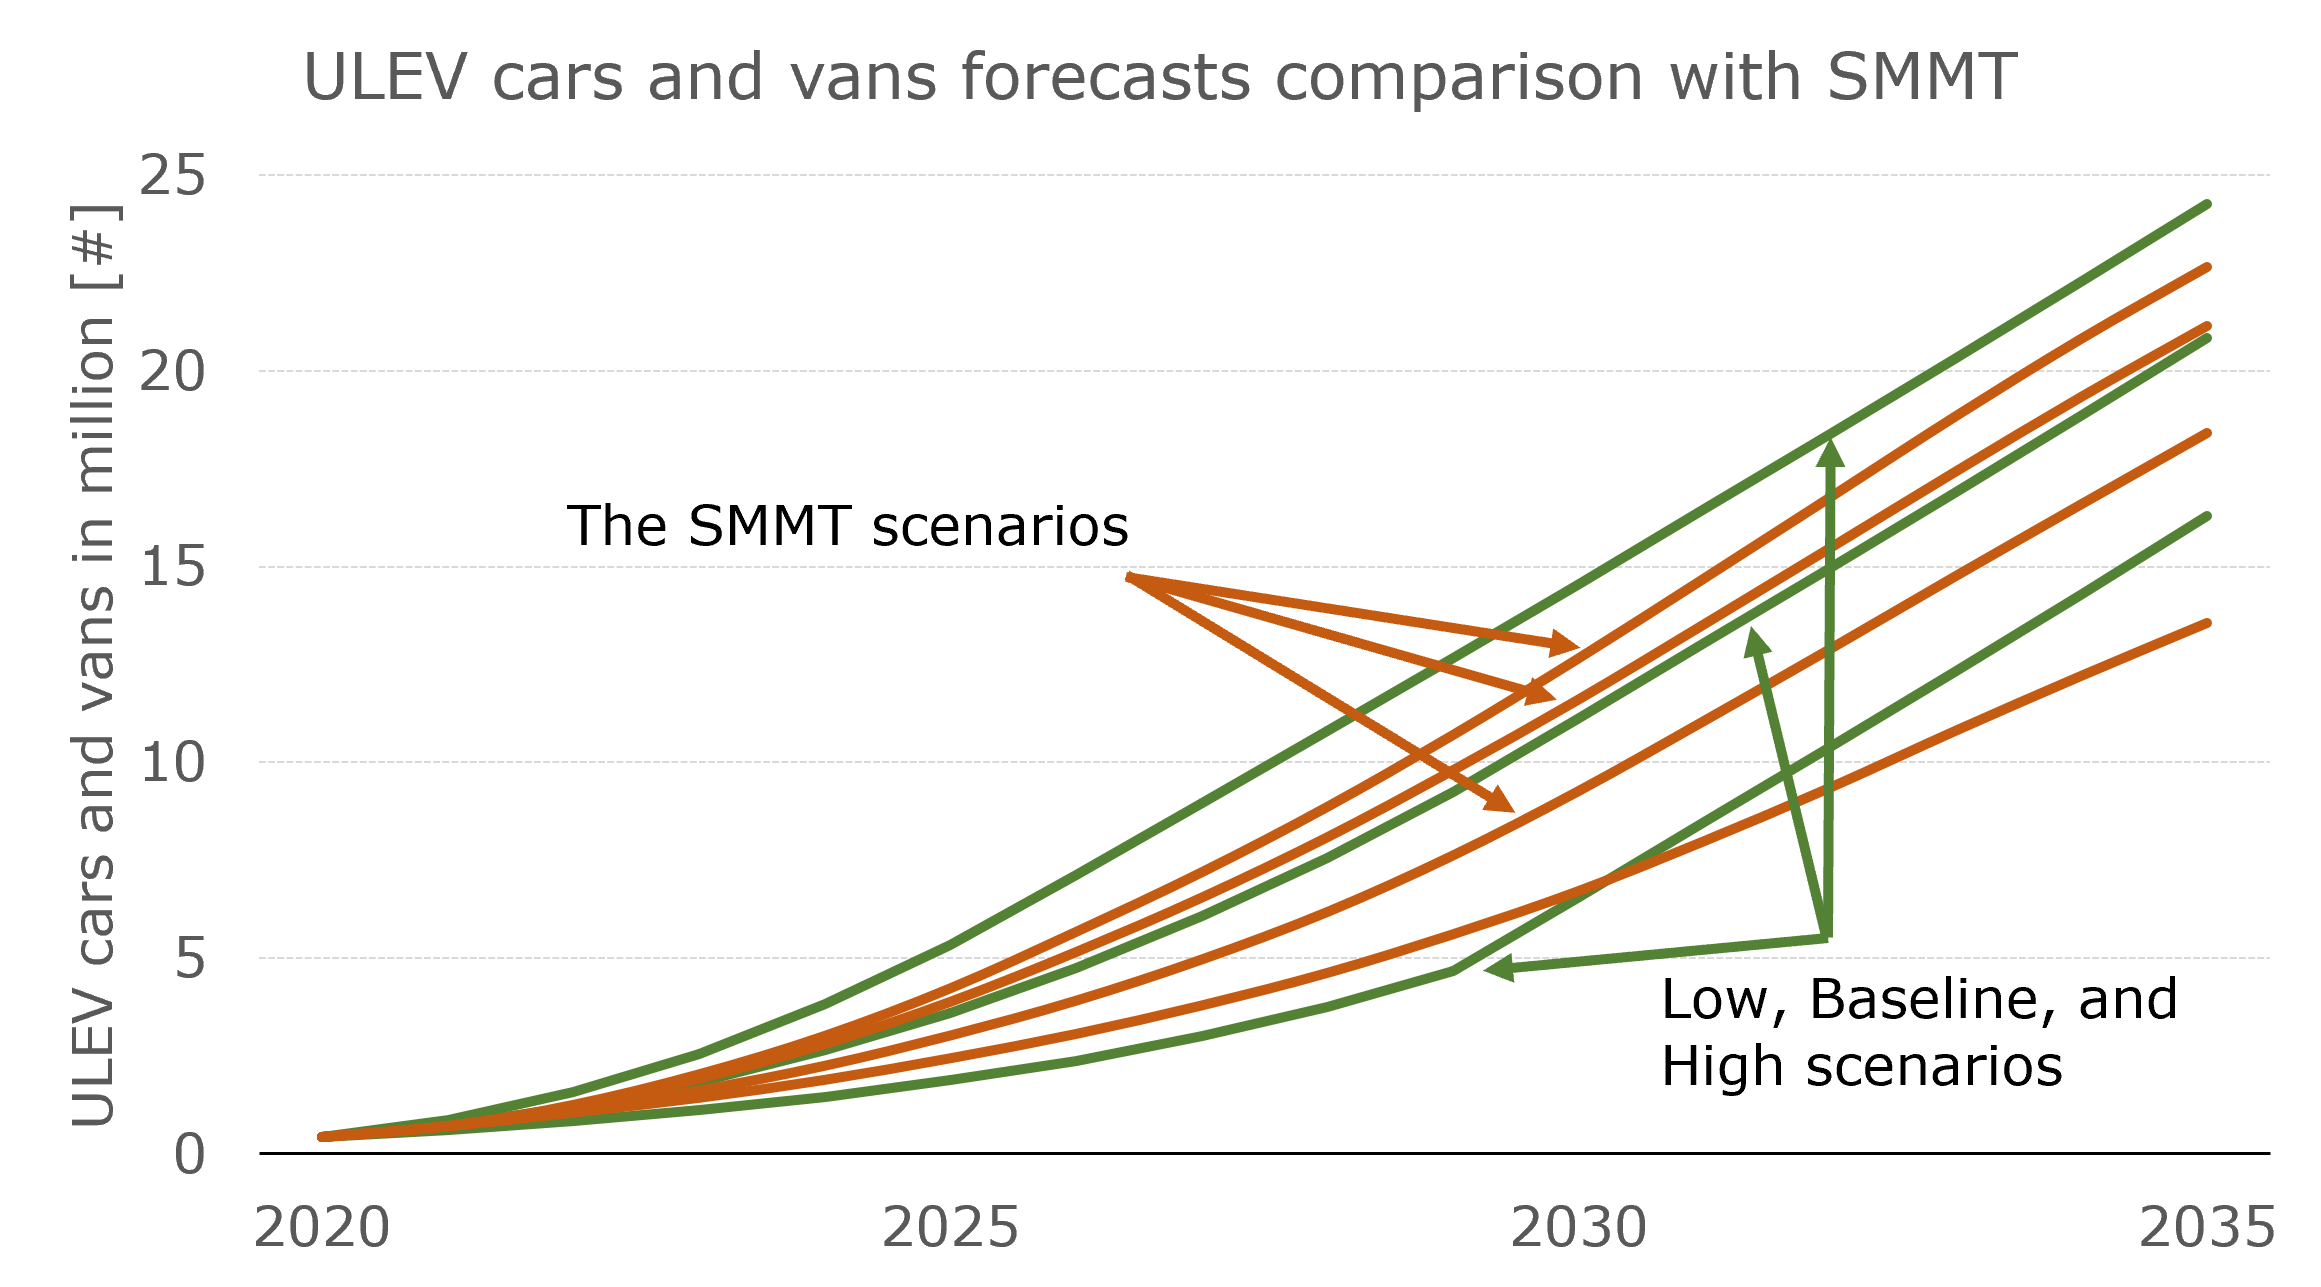
These predictions are compared with other forecasts to validate the methods and results. Two forecasts from the Climate Change Committee (CCC) and from the Society of Motor Manufacturers and Traders (SMMT) published respectively in December 2020 and October 2021 are used for comparison. The CCC forecasts a quicker ULEV uptakes between 2030 and 2045 than the calculated forecasts. From 2045, both the CCC and calculated predictions are similar. SMMT forecasts up to 2035 for cars only. It means a lower prediction than the calculated forecasts that consider cars and vans. This difference (about 10% less) is not a big issue considering the prediction margin error. All SMMT scenarios are within low and high forecasted scenarios except for SMMT low scenario. The calculated forecasts are comparable to others despite some differences probably due to assumptions taken, data and methodology followed.
 |
 |
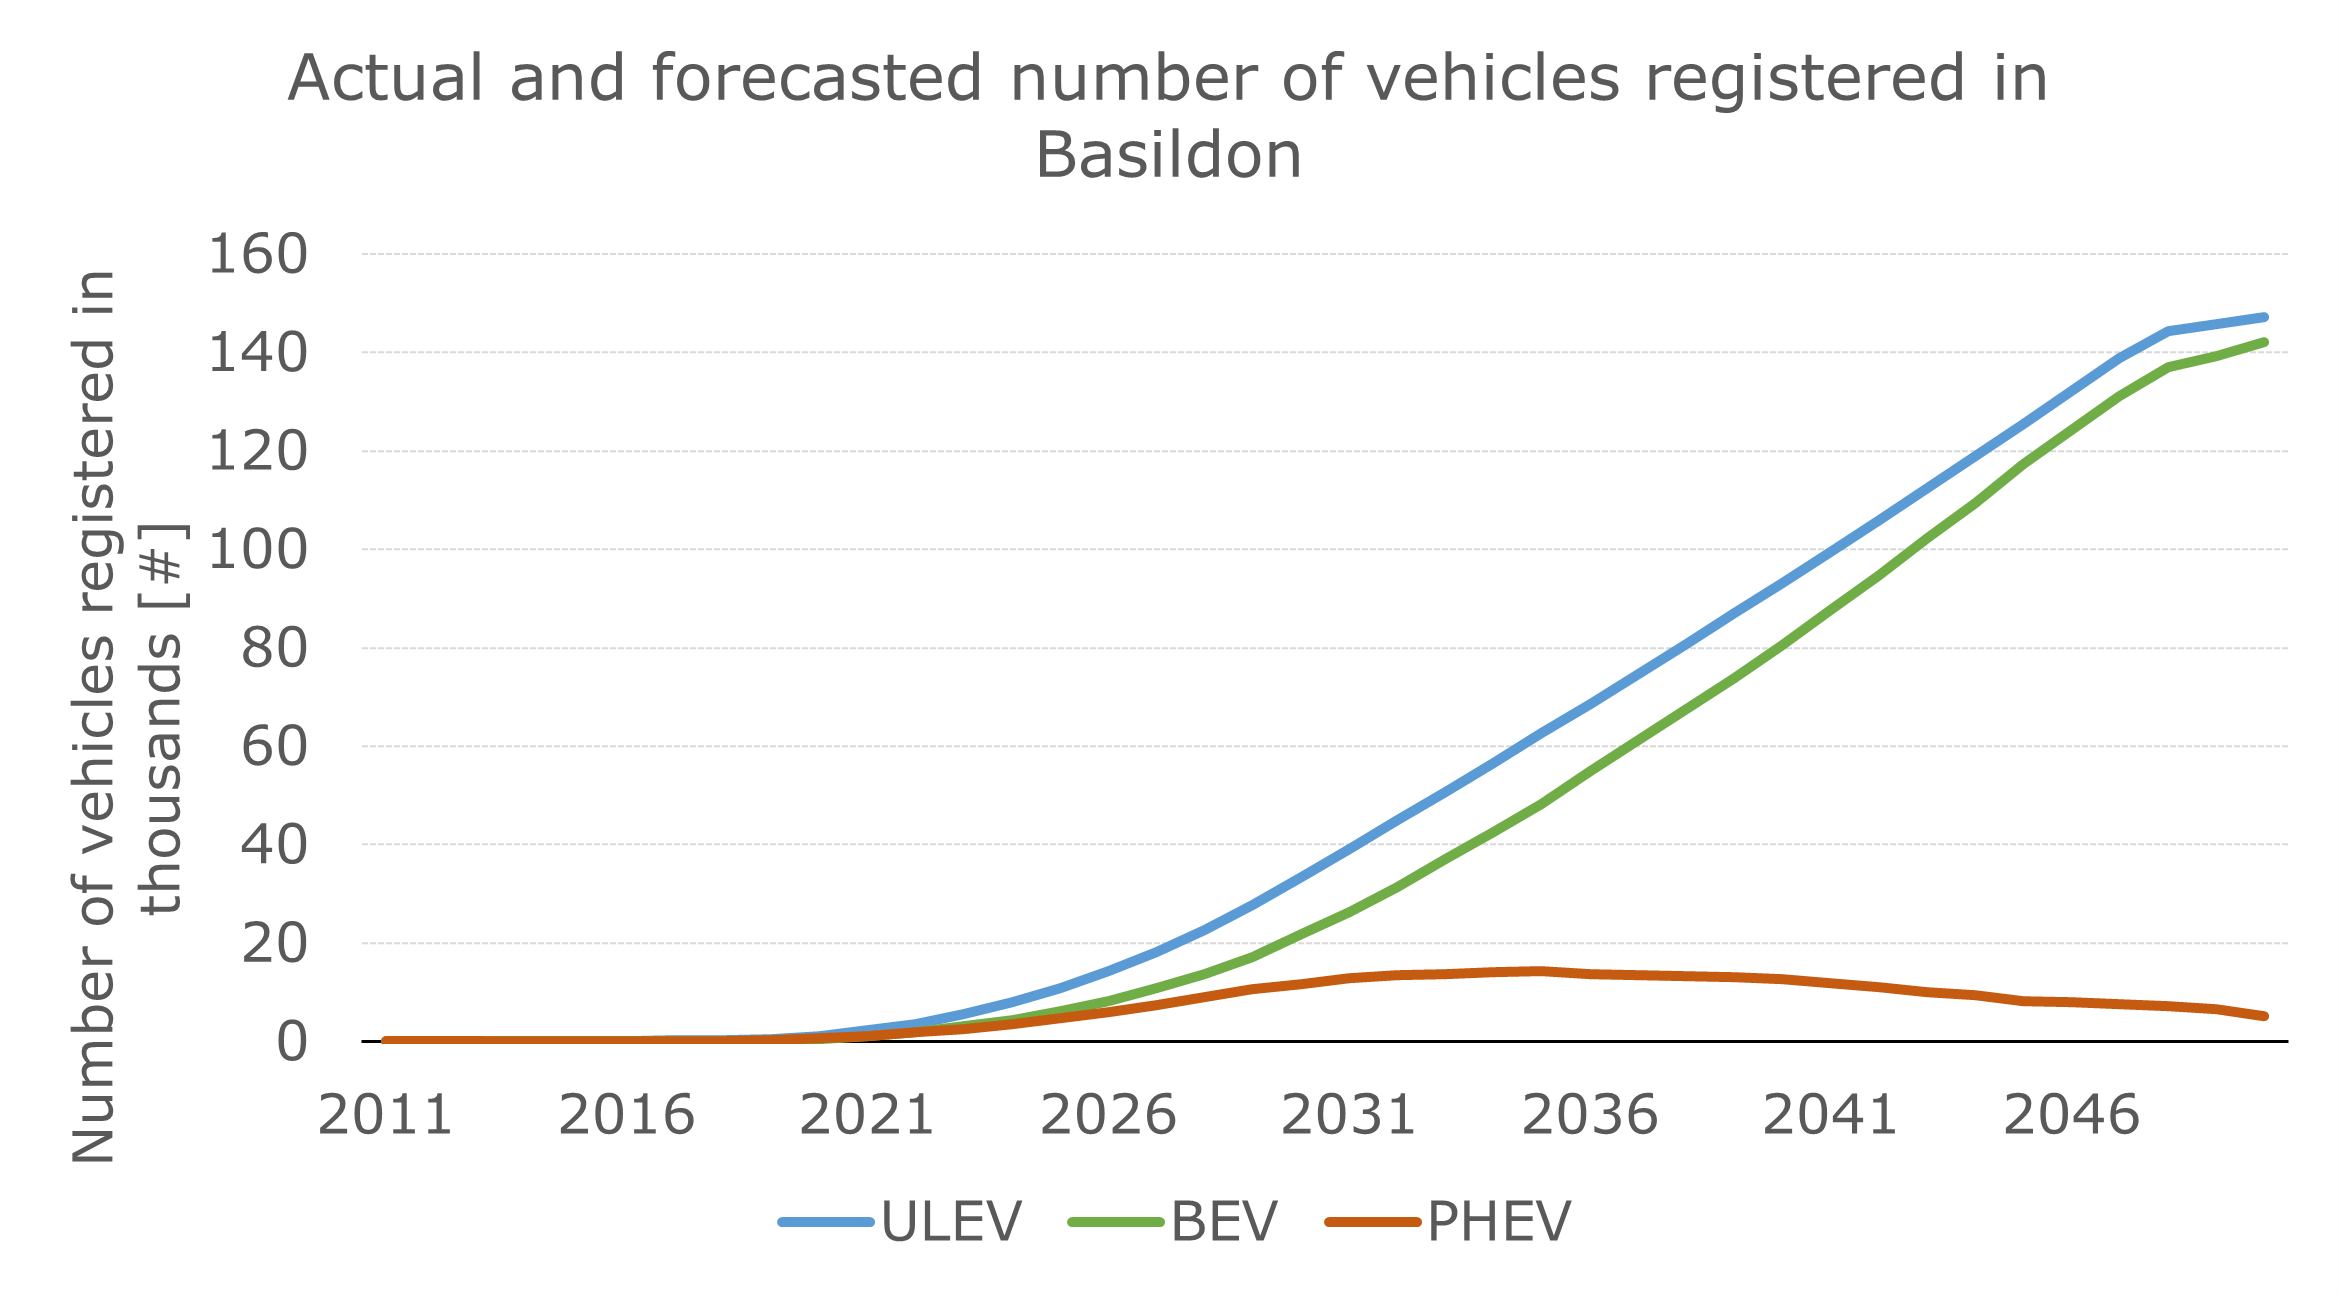
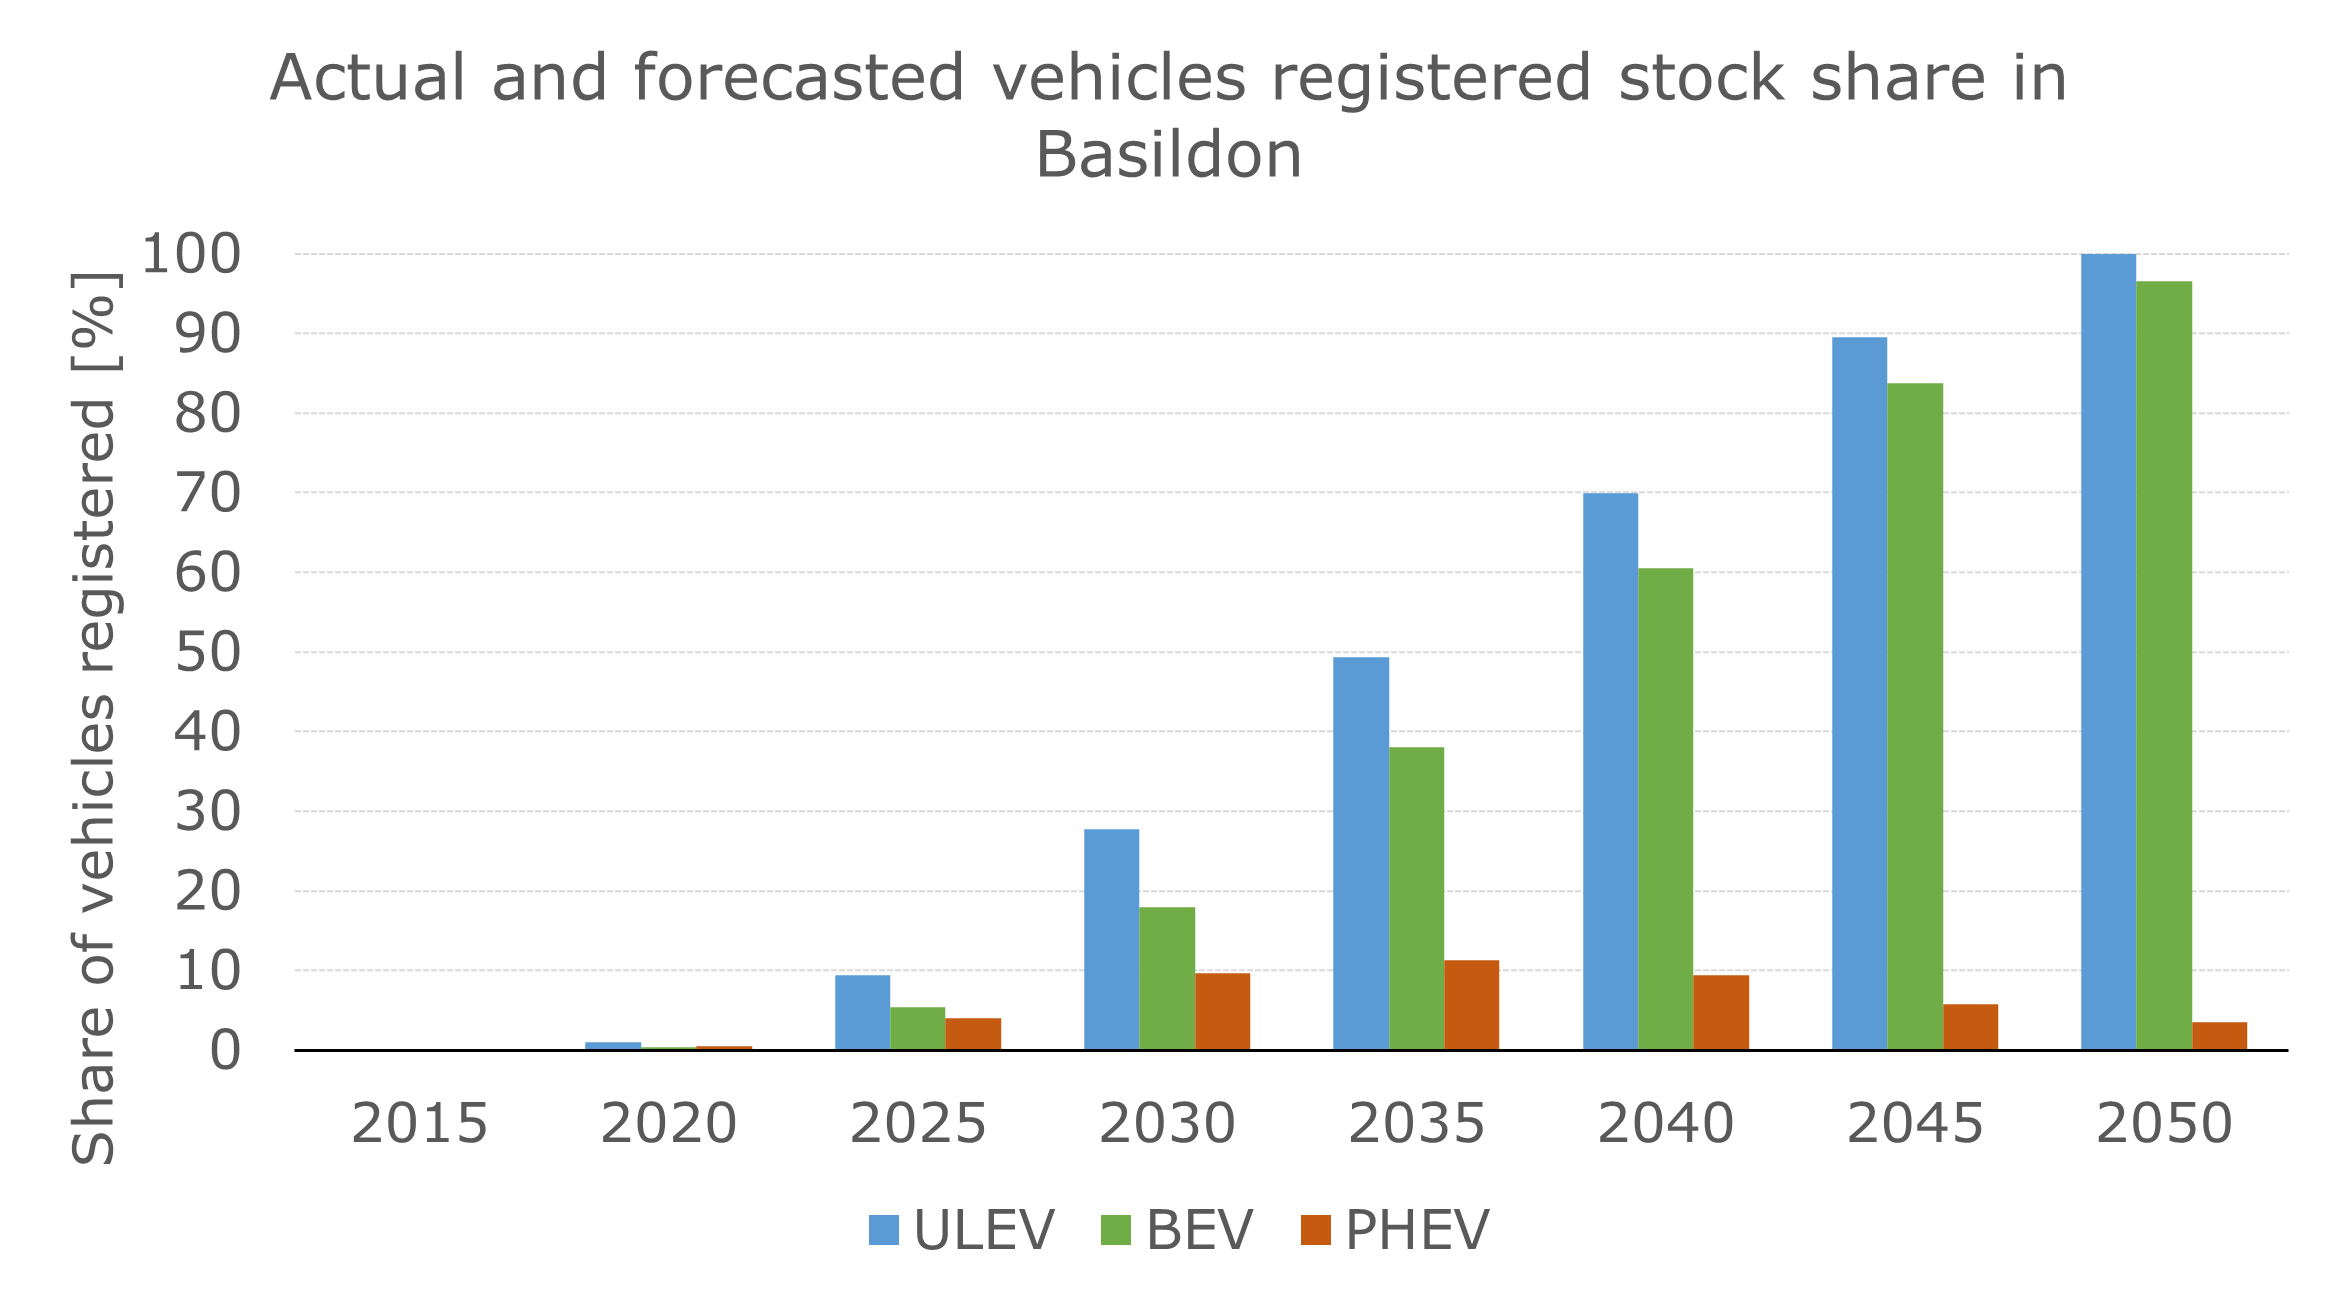
This forecast method developed and validated at GB level, is applied to Basildon borough which is the chosen area where the location of charging infrastructure will be defined. The number of ULEV is predicted assuming the baseline scenario. It is assumed that ULEV is only made of BEV and PHEV. As BEV and PHEV have different charging needs, the number of each of these vehicle’s categories will be predicted. The data show similar share between BEV and PHEV categories, about 50% each. The trend goes toward an increased shared of BEV over PHEV. The number of PHEV registered will slightly increase until 2035 before going down while the number of BEV will constantly increase.
 |
 |
The location of Charging Stations (CS) is a complex process that requires many parameters to consider. This project only focusses on the residential areas based on charging demand led by the number of BEV and PHEV. The objectives of this part are to define the number of charging stations for a given residential area and their locations according to the baseline scenario. This simplified approach does not consider the installation cost, the electrical network capability, and charger plug type. Alongside with Python used from the beginning of this project, QGIS (version 3.24.1) will be used to help with the geospatial and network analysis and visualisation.
Additional data are required about the land use to get the residential areas and the roads layout to calculate the network distances between the charging stations and the household equipped with BEV or PHEV. The residential land use is queried from QGIS using Open Street Map (OSM) data. Then within the residential areas, the number or building and their locations is required. This is available from Unique Property Number Reference (UPRN) datasets from Ordnance Survey. These datasets do not need any pre-processing, they are ready to be used. The Basildon borough boundaries data pre-processed earlier, and the additional data queried enable the map (figure below), to be created using QGIS.
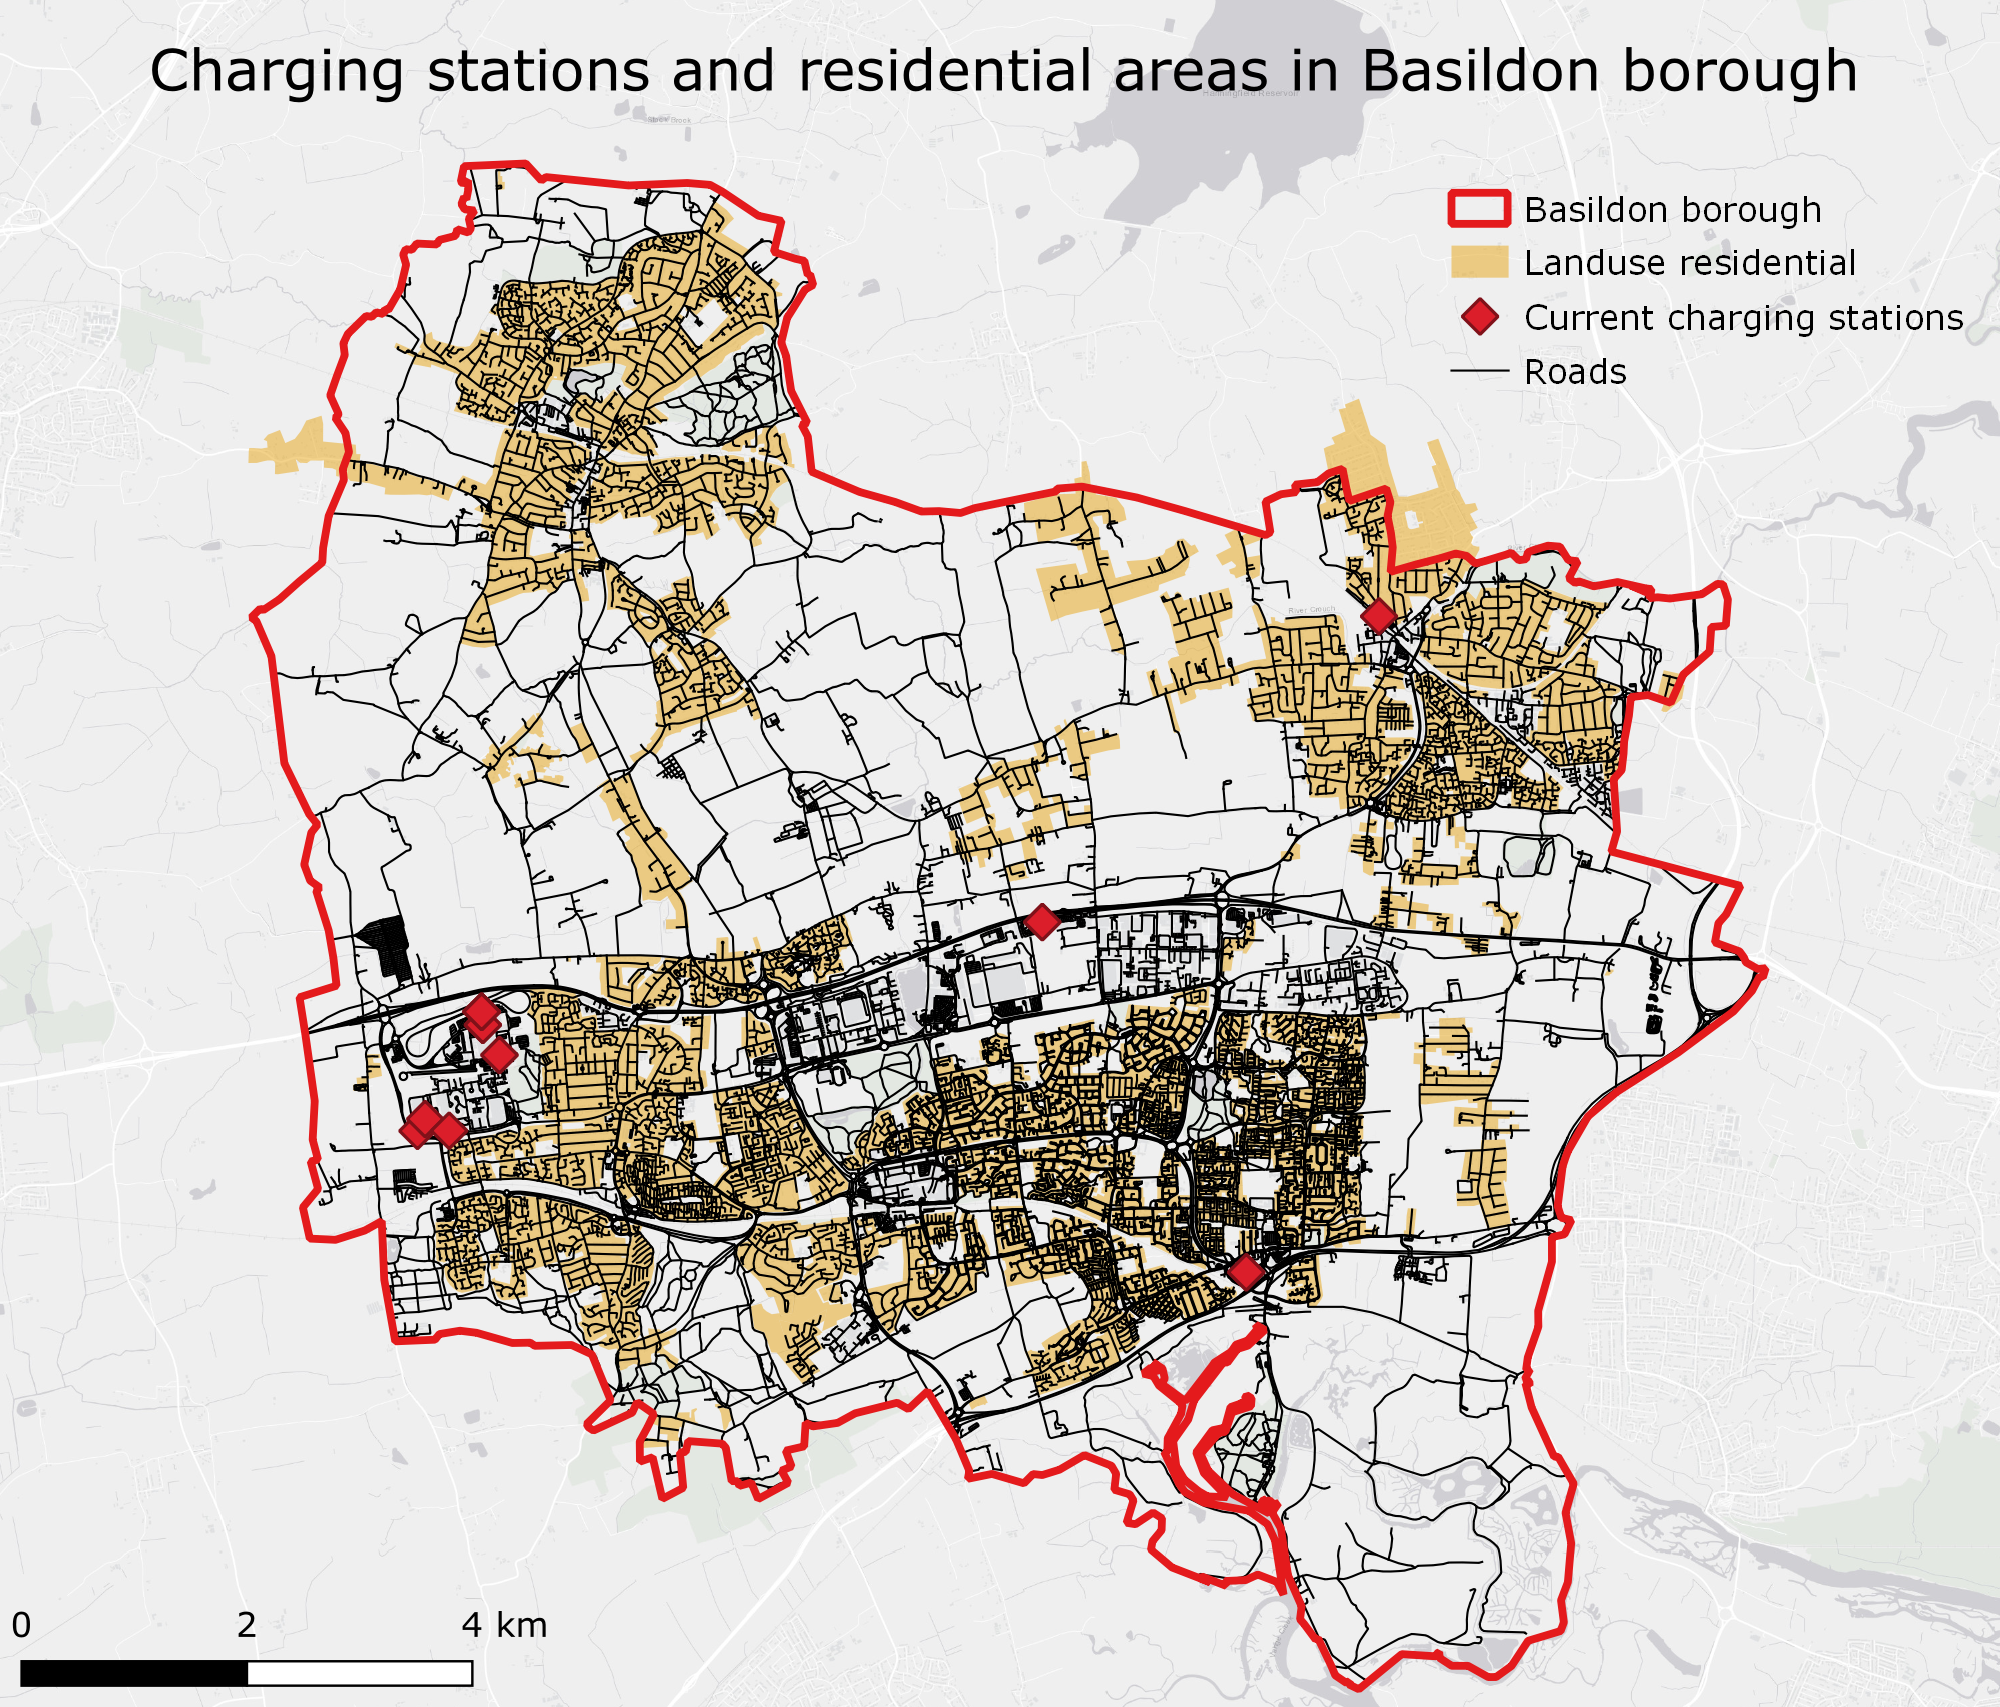
The UPRN points are not displayed on the map as there are about 81,000 households. The UPRN points have been filtered based on the residential areas. This number of households is compared with the real figures from official sources to validate the approach. As mentioned before there are only 18 charging stations in Basildon and none of them are located within a residential area. The households without private driveway are very unlikely to purchase a BEV if home charging is not possible.
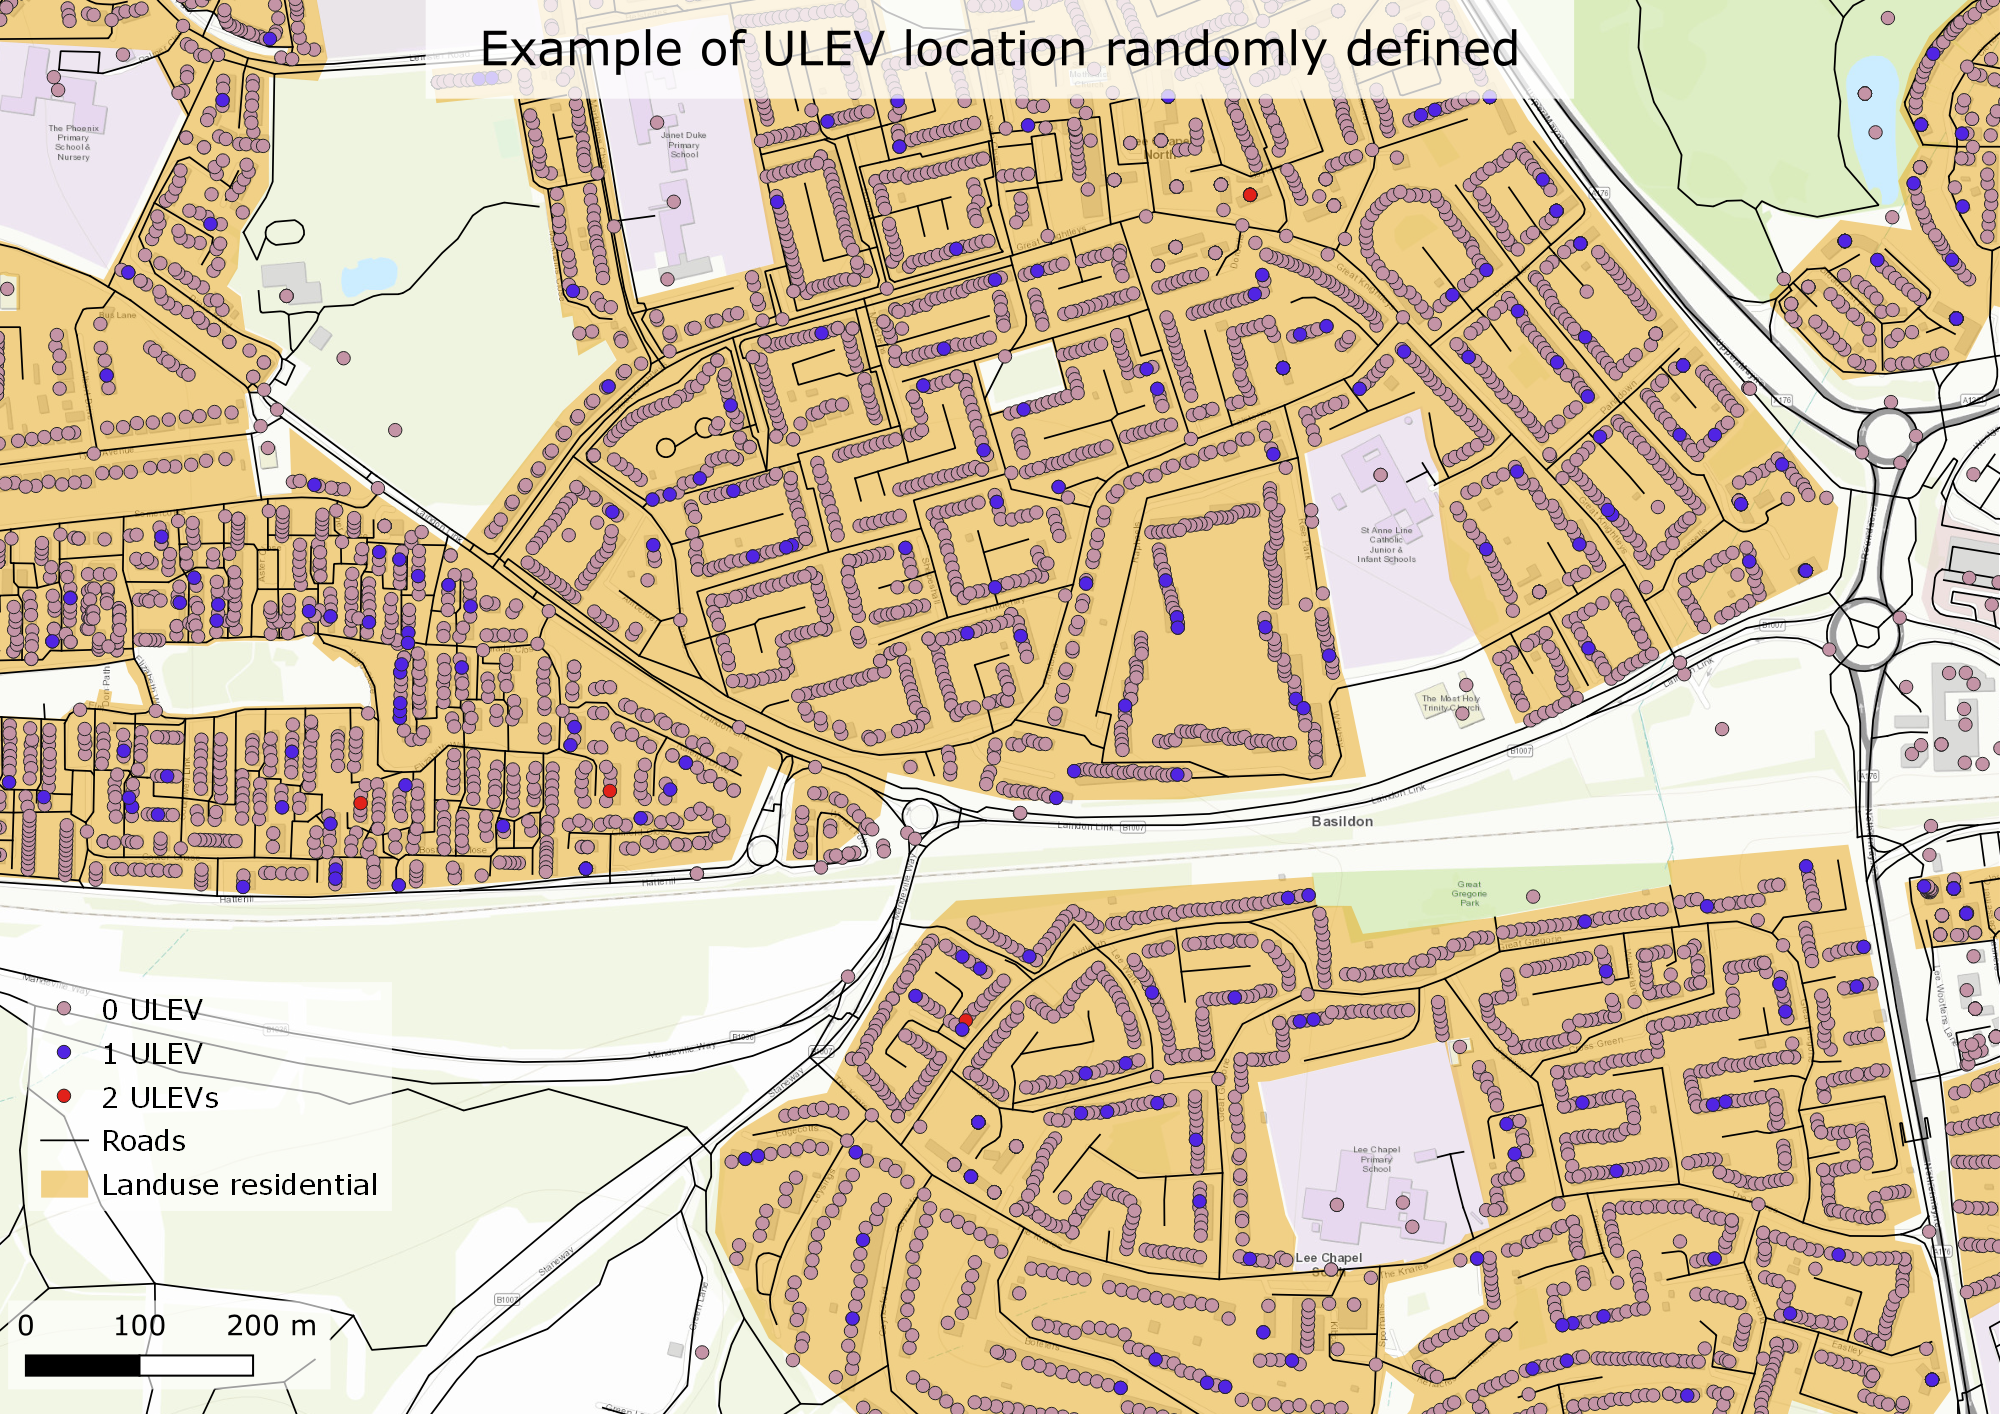
The exact ULEV locations are not available due to confidentiality reason. The amount of ULEV will be randomly allocated amongst the 81,000 households assuming two ULEV max per household. There are currently no chargers in residential areas so instead of planning for 2030 or 2050 a plan for 2022 should be more appropriate. The forecast part predicted 3,600 ULEVs in Basildon for 2022 with equal share between BEV and PHEV, 1,800 vehicles each. A Python script embedded to QGIS is created to randomly allocate the ULEV ensuring a balance spread. The light purple points are the households without any ULEV, the blue points are the households with one ULEV and the red points are households with two ULEVs.
The number of CS must be defined considering the demand. This demand will be calculated based on average vehicle usage and range capacity. On average, the daily distance driven in the UK was 32km per day (20 miles/day) in 2019. The BEV and PHEV have different ranges, the approach taken consist of calculating the average weighted BEV and PHEV electric range using the 20 most registered BEVs and PHEVs in the UK in 2021. The ranges considered are the one given by homologation tests. The calculated weighted average is 227km. On average, a BEV/PHEV driver needs to fully charge its battery every seven days. It means one CS is sufficient for seven ULEVs. This averaged value is used as guideline to initialise the model, then some adjustments could be done for a better CS coverage.
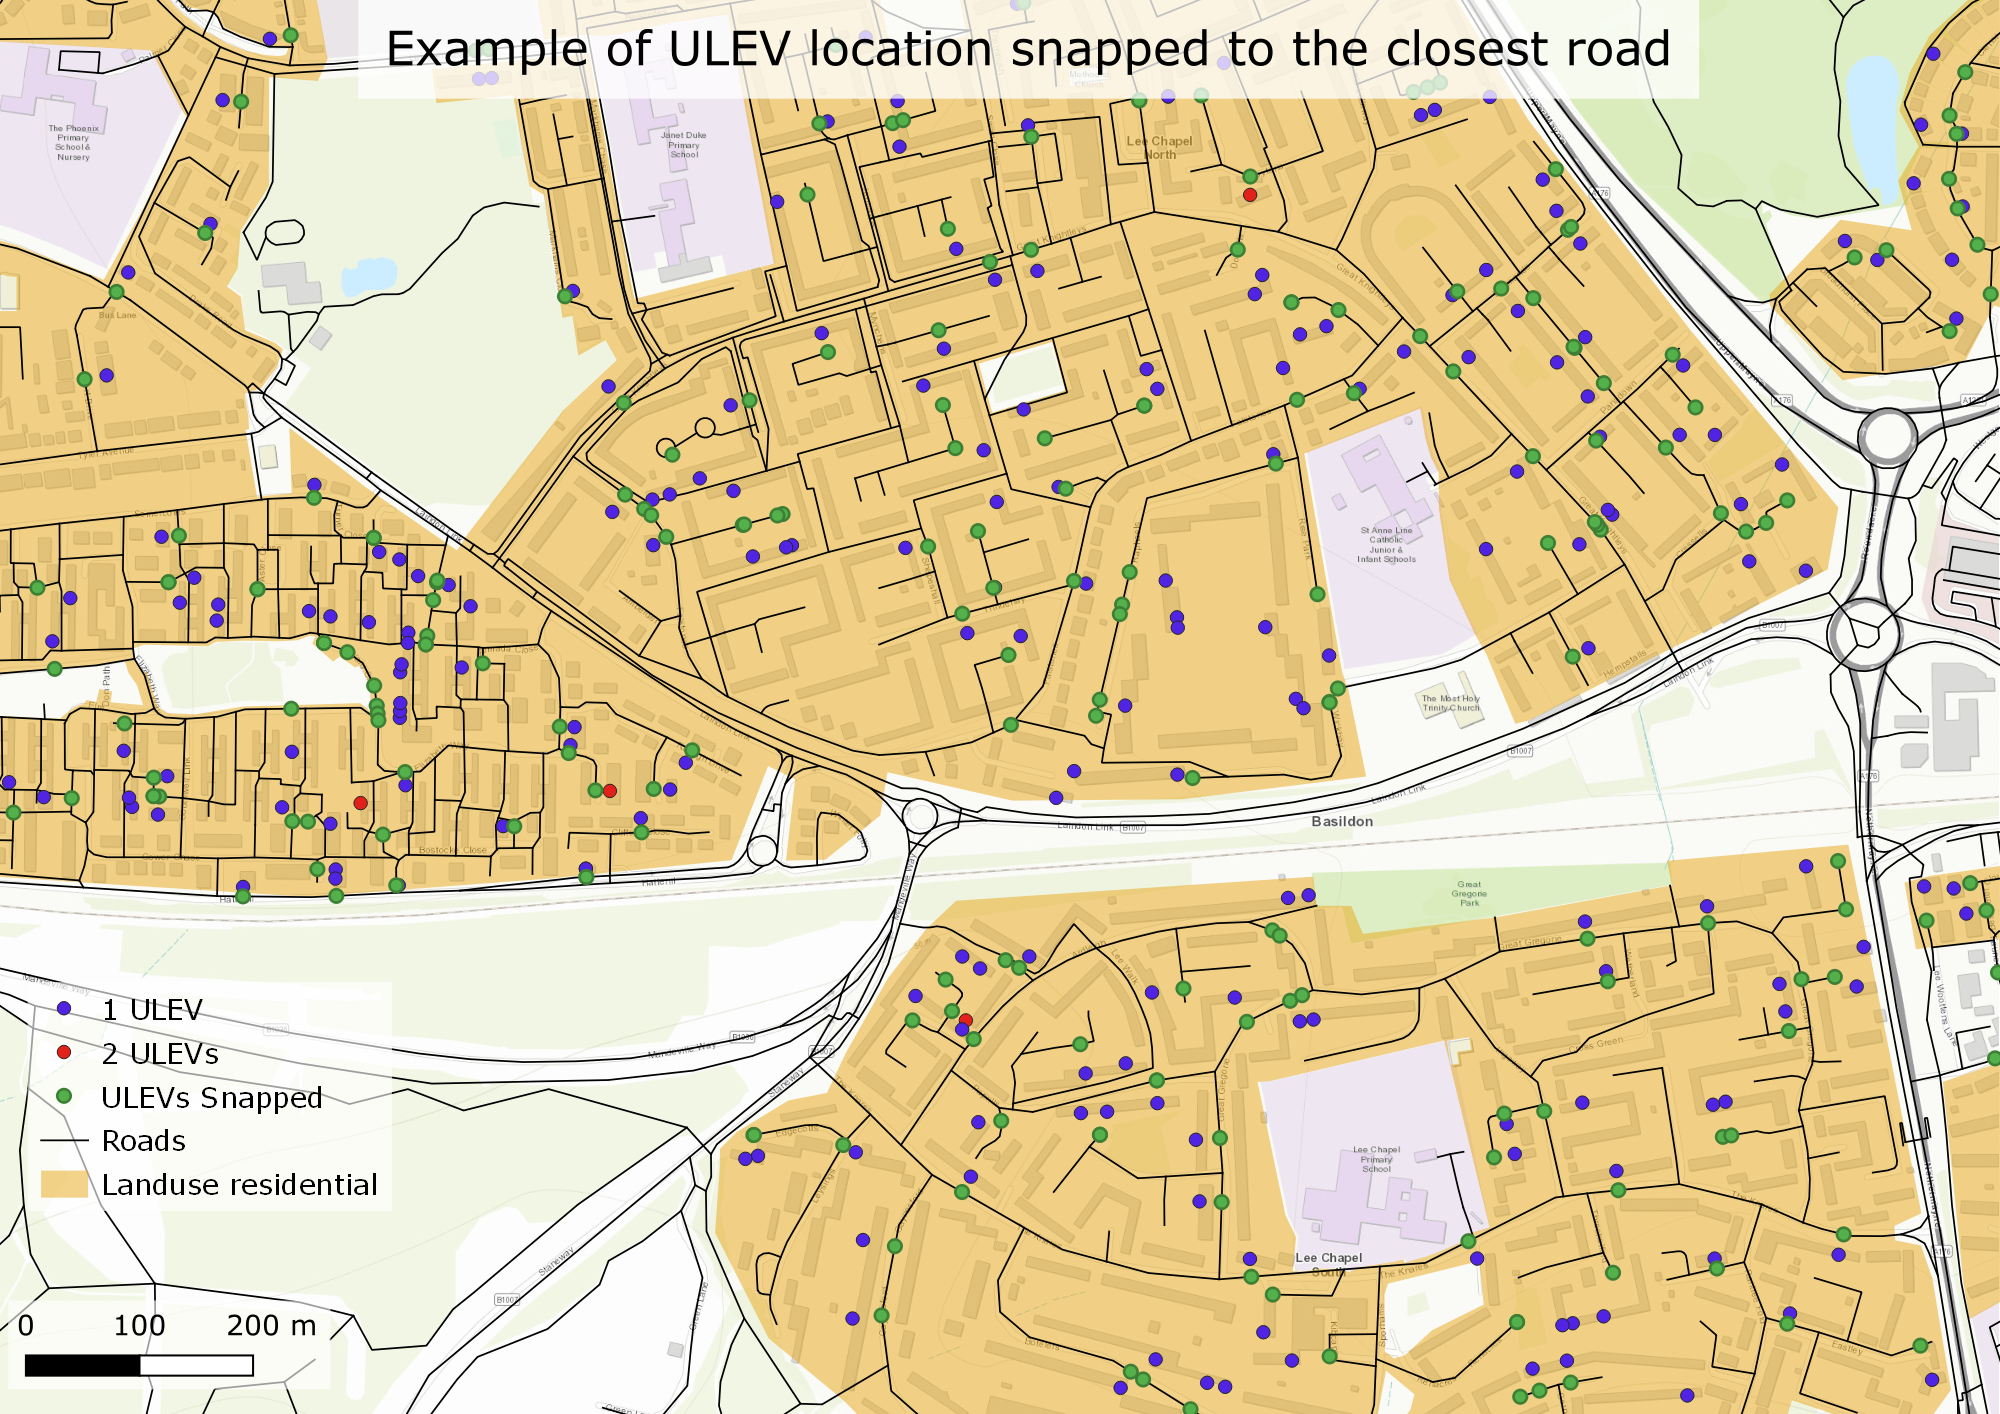
The UPRN locations with at least one ULEV are snapped to the closest road. This is important to snap the points to the closest road as the distance between the
households and the CS is calculated using the road layout. A Python script, using scikit-learn library, embedded to QGIS is developed to define the CS locations. The
script handles iteratively each residential area with a for loop to:
- Calculate number of CS
- Run constrained K-means algorithm (number of clusters defined by number of CS)
- Get centroid location of clusters
- Snap centroids to the closest road (one centroids = one CS)
- Calculate the distance between the centroid and household using road layout
- If minimum distance ≥ threshold add a CS and repeat above steps up to 10 times
The minimum distance threshold is set as 200m as it is within acceptable walking distance. The additional iterations due to the minimum distance criteria is arbitrary
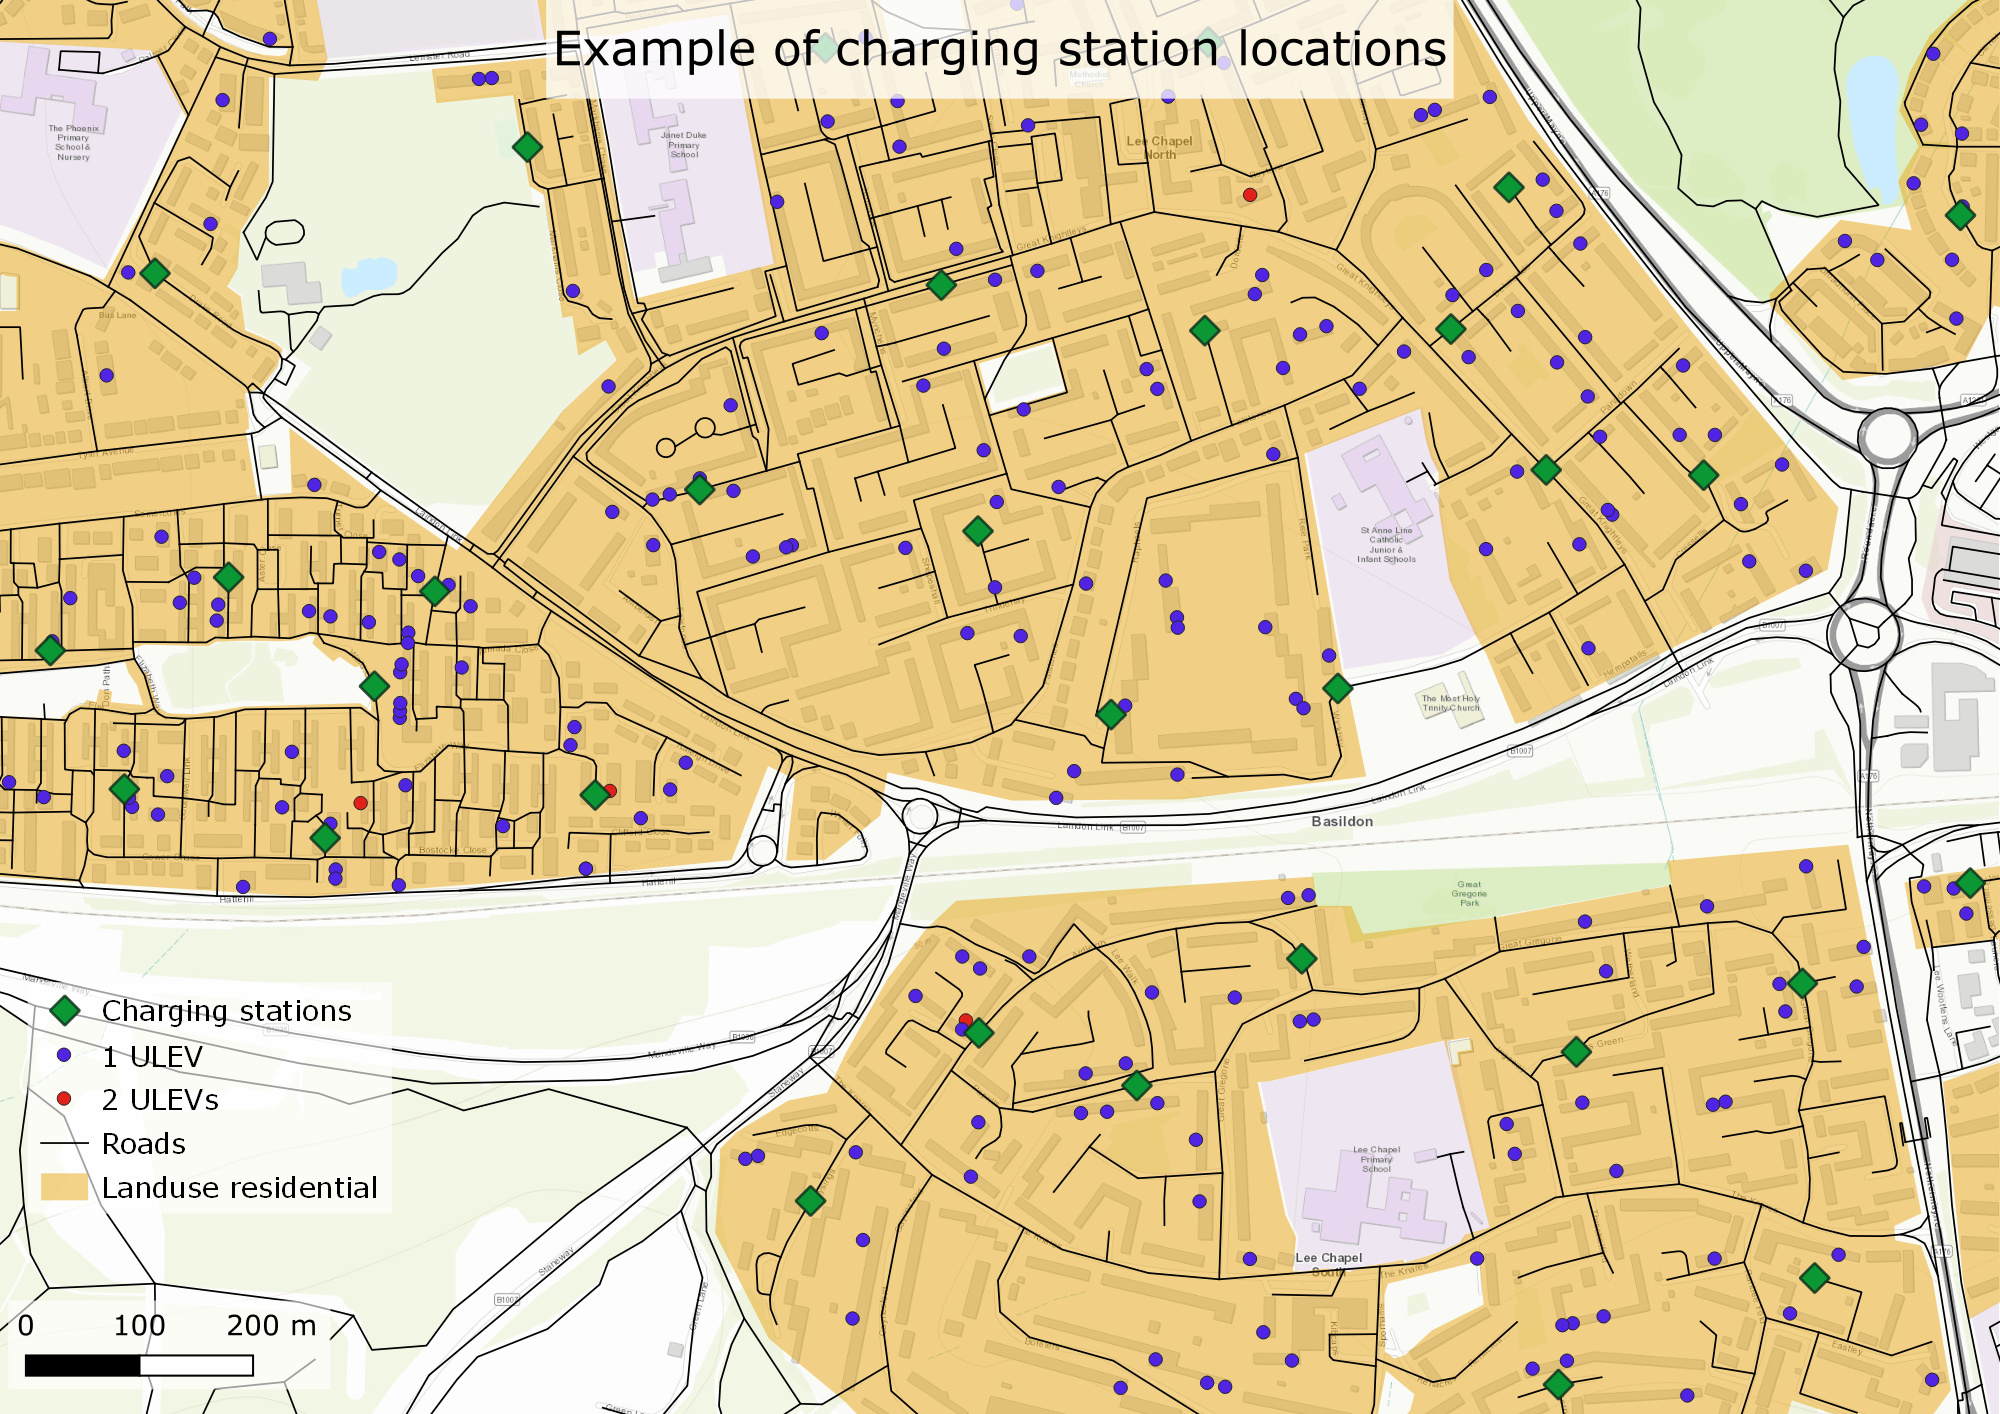
limited to 10 to avoid infinite loop. The script runs about 40 minutes on Windows 10 64bits with processor i5-8350U 1.9GHZ, 8GB RAM. The figure below gives an example of
CS locations for a neighbourhood. The initial CS number is 531 and after checking the distance between the CS and the households the number of CS is increased by 115
to reach 646 CS.
Charging station is a topic that must be planned ahead considering the charging demand and the limitations due to for example the grid capacity. The simple approach
detailed in this paper is easy to implement. It can be used as a first planning step to understand the current situation for a given area and suggest where the charging
stations could be installed. The work described is limited to home charging, in reality the charging can be done in other places, e.g., office, shopping car park.
This approach is limited by different factors such as lack of accurate information about the BEV locations or information about home chargers. More data, like the BEV
usage, will help to improve this approach, the challenge here is about the data confidentiality which makes it difficult to get access to these data.
As next steps, considering the electrical grid capability would be useful to define which power the connectors installed could deliver. The cost of charging station
installation could be also considered as some locations may require more urban redesign than others.